11只中證A500ETF規模超百億,中證A500躍升為A股第二大寬基指數
指數化成為重要方向,中證A500相關產品發佈以來較受市場青睞。從首批中證A500ETF上市後的市場反饋來看,投資者對A500ETF的認可度較高。
目前場內跟蹤中證A500的ETF合計規模超過2000億元,超越科創50,成為僅次於滬深300的第二大寬基標的。
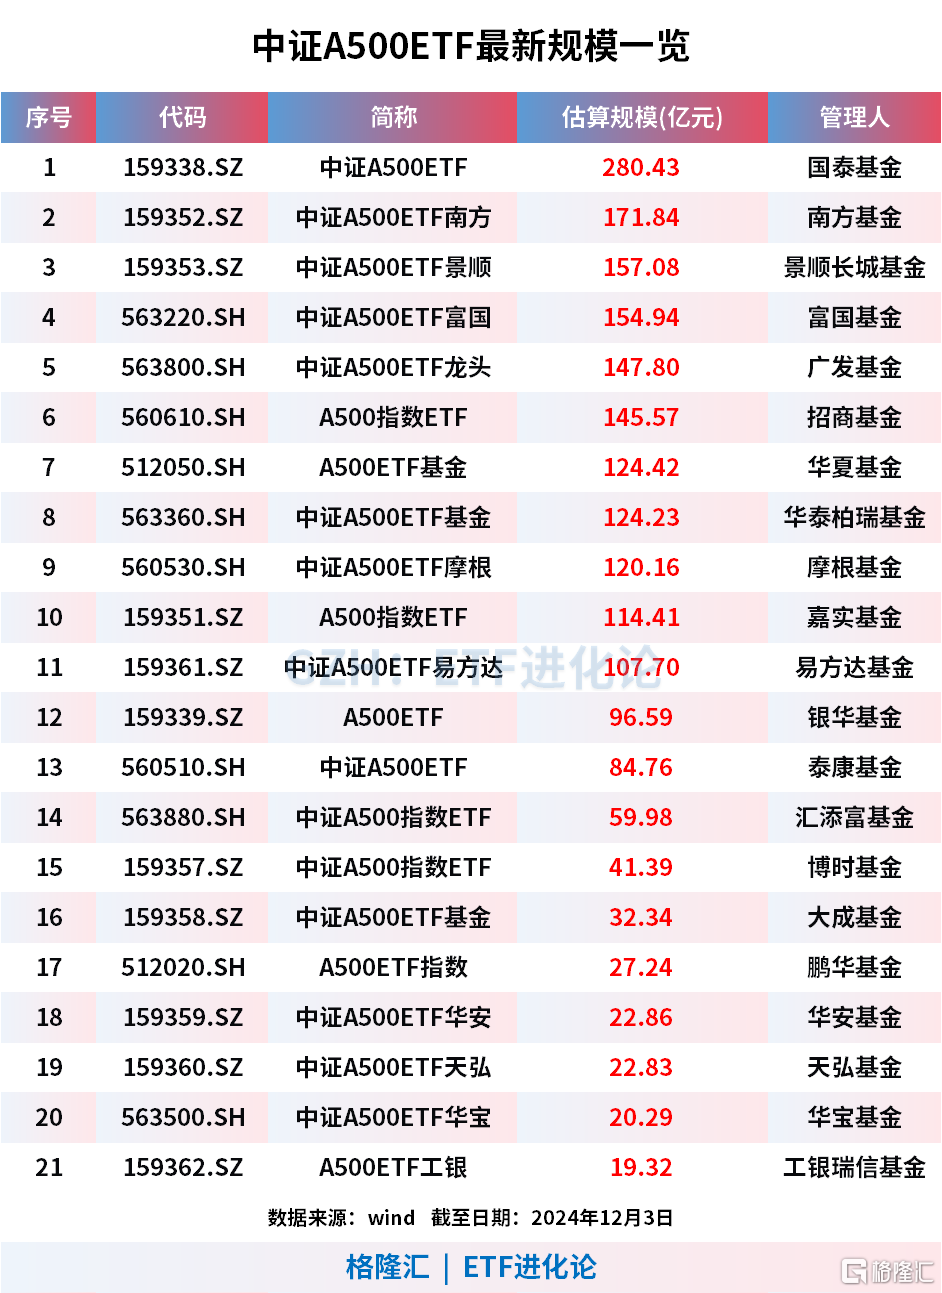
截至12月3日,11只跟蹤中證A500指數的ETF規模超百億。其中,國泰中證A500ETF、中證A500ETF南方、中證A500ETF景順、中證A500ETF富國、廣發中證A500ETF龍頭、招商A500指數ETF、華夏A500ETF基金、華泰柏瑞中證A500ETF基金、中證A500ETF摩根、嘉實A500指數ETF、中證A500ETF易方達最新規模為280.43億元、171.84億元、157.08億元、154.94億元、147.80億元、145.57億元、124.42億元、124.23億元、120.16億元、114.41億元、107.70億元、96.59億元、84.7659.98億元、41.39億元、32.34億元、27.24億元、22.86億元、22.83億元、20.29億元、19.32億元。
興業證券研報指出,從市值、行業、成分股等多維度來看:
中證A500以大中盤風格為主,市值暴露位於滬深300和中證800之間;細分行業覆蓋度高,行業契合未來經濟發展方向。指數與中證全指的行業配置最為接近;同時,指數包含眾多新質生產力行業。成分股聚焦大市值標的,龍頭與均衡屬性兼備。
指數表現長期業績優異。中證A500指數自基日以來的累計收益為361.48%,年化收益率8.01%,超越了上證50指數、滬深300指數及中證800指數。
估值水平,位於統計區間較低位置,具備配置價值。指數高盈利疊加高成長,把握優質龍頭資產。指數整體ROE高於中證500、中證800以及萬得全A;預期淨利潤增速均高於滬深300及中證800。
綜上,興業證券認為,中證A500指數的表徵性和可投資性俱佳,對於長期資金而言,中證A500是對A股更具代表性,並且容量更大的載體。
申萬宏源研報指出,跨年行情關注中證A500指數,邏輯基於:
(1)中證A500指數是A股核心資產的代表,且相比於滬深300指數,A500指數權重更偏向於成長風格。展望2025年,成長核心資產盈利有望邊際改善。從最新披露的2023年上市公司三季報推演,後續中游製造供給壓力有望大幅緩和,而科技、醫藥當前資本開支也仍處於供給低位,疊加需求側彈性以及低基數效應,2025年盈利預計邊際改善。從當前Wind一致預期來看,A500指數權重股中的電子、電力設備、醫藥、汽車、軍工等行業2025年盈利預測相比2024邊際提升。
(2)與傳統的成長風格指數相比,中證A500指數增加了基本面穩健的價值行業權重:與創業板指相比,中證A500指數在銀行、食品飲料、公用事業、家電等行業的權重更高,這部分行業作為價值穩定器,也更好地控制了指數波動性,中證A500指數在A股核心資產的配置上更加均衡。從歷史業績回溯來看,中證A500指數的累計回報以及夏普比率均優於滬深300指數和創業板指。
Follow us
Find us on
Facebook,
Twitter ,
Instagram, and
YouTube or frequent updates on all things investing.Have a financial topic you would like to discuss? Head over to the
uSMART Community to share your thoughts and insights about the market! Click the picture below to download and explore uSMART app!

Disclaimers
uSmart Securities Limited (“uSmart”) is based on its internal research and public third party information in preparation of this article. Although uSmart uses its best endeavours to ensure the content of this article is accurate, uSmart does not guarantee the accuracy, timeliness or completeness of the information of this article and is not responsible for any views/opinions/comments in this article. Opinions, forecasts and estimations reflect uSmart’s assessment as of the date of this article and are subject to change. uSmart has no obligation to notify you or anyone of any such changes. You must make independent analysis and judgment on any matters involved in this article. uSmart and any directors, officers, employees or agents of uSmart will not be liable for any loss or damage suffered by any person in reliance on any representation or omission in the content of this article. The content of the article is for reference only and does not constitute any offer, solicitation, recommendation, opinion or guarantee of any securities, virtual assets, financial products or instruments. Regulatory authorities may restrict the trading of virtual asset-related ETFs to only investors who meet specified requirements. Any calculations or images in the article are for illustrative purposes only.
Investment involves risks and the value and income from securities may rise or fall. Past performance is not indicative of future performance. Please carefully consider your personal risk tolerance, and consult independent professional advice if necessary.


