光伏ETF逆勢調整,多家機構表示看好未來行情
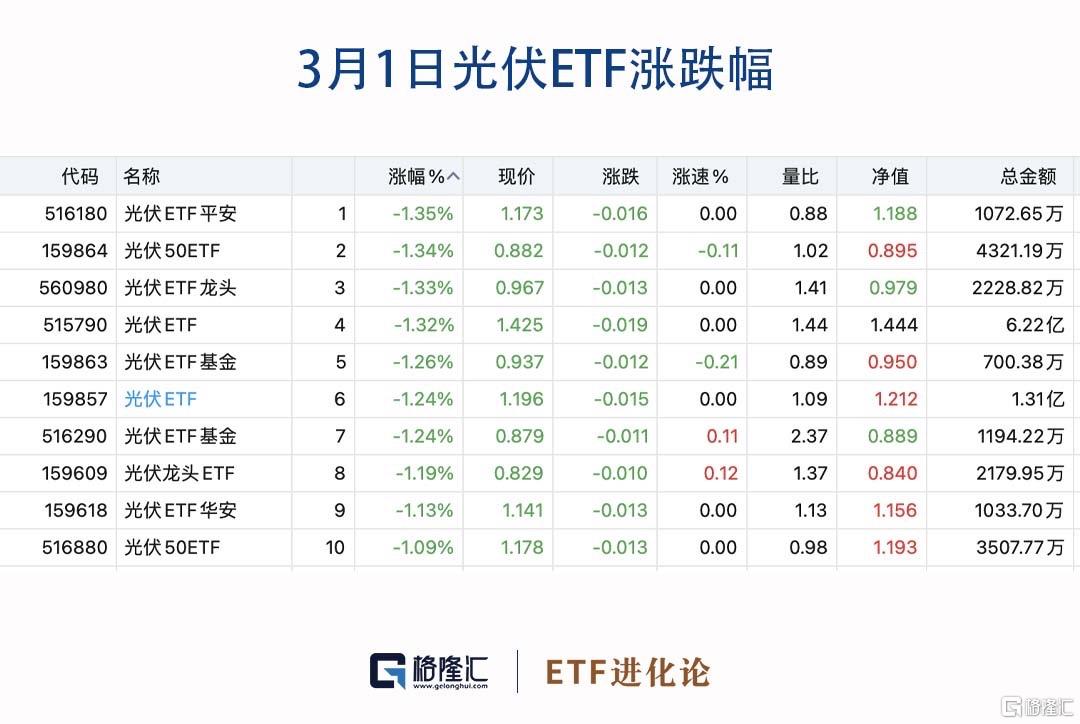
滬指今日走強,盤中突破3300點,而光伏上司公司逆勢調整,固德威跌超5%,陽光電源、晶澳科技跌超3%,晶科能源跌超2.5%。場內跟蹤中證光伏產業指數的9只ETF集體跌超1%。
固德威2月27日公吿,2022年公司實現營業總收入47.13億元,較上年增長75.99%;歸屬於母公司所有者的淨利潤6.52億元,較上年增長133.35%;扣非後歸母淨利達6.27億元,較上年增長156.05%。
業績上升的主要原因是公司儲能逆變器及電池銷量大幅增加,同時下半年歐元、美元對人民幣匯率總體提升等綜合因素所致。
晶科能源發佈2022年績快報,報吿期內公司實現營業收入830.75億元,同比增長104.77%;實現歸母淨利潤29.47億元,同比增長158.21%。
目前光伏組件市場成交價格在1.7元/W附近。 隨着上游成本的企穩,市場看空或者看升的情緒都逐漸平息。春節後,廠區全部處於滿產狀態,20條生產線全開,基於市場穩定和員工節後返崗情況良好等條件,預期到3月份整個市場的回暖會更加明顯。
今年以來,光伏行業一體化佈局趨勢持續加深,通威股份、隆基綠能等頭部廠商繼續加碼一體化產能,補齊產能弱項。
從上市公司發佈的業績預吿看,儘管光伏行業普遍預喜,但去年四季度已出現明顯分化。業內人士認為,始於去年末的降價潮近期已漸平穩,產業鏈進入利潤再分配階段。硅料降價讓渡的利潤將主要在下游電池、終端等環節重新分配,而一體化佈局的廠商最為受益。
光伏產業鏈價格由去年的中上游大幅上升,到今年大幅度波動,原因一方面是因為供需關係出現了變化,另一方面是產業鏈各環節尤其是中上游環節的利益博弈。
國元證券稱綜合多方專業機構預測,2023-2025年全球光伏裝機將保持25%以上年複合增長,預計2025年新增全球裝機量有望達到 500GW。光伏膠膜在光伏裝機強勁帶動下市場規模不斷擴容。我們假設容配比為1.2,1GW組件需要約1億平米膠膜,測算出2022年-2025年的光伏膠膜需求量分別為28億平米、42億平米、53億平米和60億平米;2022年-2025年光伏膠膜市場規模分別為人民幣(下同)386億元、546億元、683億元和780億元。光伏膠膜市場需求快速增長,行業景氣持續向上。
預計2023年隨着硅料產能釋放,硅料價格將回歸理性區間,光伏上中游產業鏈價格下行將帶來下游光伏電站投資收益上升,進而刺激光伏裝機需求快速釋放。而硅料價格理性迴歸也將帶來光伏產業鏈價格調整,價格博弈疊加光伏裝機需求增長,中下游及輔料環節的讓利壓力將得到緩解。光伏膠膜環節作為組件生產的重要輔材之一,將受益行業利潤重分配,膠膜企業盈利能力修復向上趨勢確定。
中原證券發佈研究報吿稱,展望2023年,隨着產業鏈各環節普遍擴產以及緊缺環節的供需扭轉,光伏產業鏈價格有望顯著下行,從而提升電站開發投資內部收益率,尤其是對內部收益率敏感的大型地面電站有望迎來放量階段。短期市場對光伏板塊預期較低,積極關注盈利預期改善環節和技術迭代環節投資機會。建議關注一體化組件廠、逆變器、光伏玻璃、光伏電站、TOPCon電池設備等細分領域頭部企業。
Follow us
Find us on
Facebook,
Twitter ,
Instagram, and
YouTube or frequent updates on all things investing.Have a financial topic you would like to discuss? Head over to the
uSMART Community to share your thoughts and insights about the market! Click the picture below to download and explore uSMART app!

Disclaimers
uSmart Securities Limited (“uSmart”) is based on its internal research and public third party information in preparation of this article. Although uSmart uses its best endeavours to ensure the content of this article is accurate, uSmart does not guarantee the accuracy, timeliness or completeness of the information of this article and is not responsible for any views/opinions/comments in this article. Opinions, forecasts and estimations reflect uSmart’s assessment as of the date of this article and are subject to change. uSmart has no obligation to notify you or anyone of any such changes. You must make independent analysis and judgment on any matters involved in this article. uSmart and any directors, officers, employees or agents of uSmart will not be liable for any loss or damage suffered by any person in reliance on any representation or omission in the content of this article. The content of the article is for reference only and does not constitute any offer, solicitation, recommendation, opinion or guarantee of any securities, virtual assets, financial products or instruments. Regulatory authorities may restrict the trading of virtual asset-related ETFs to only investors who meet specified requirements. Any calculations or images in the article are for illustrative purposes only.
Investment involves risks and the value and income from securities may rise or fall. Past performance is not indicative of future performance. Please carefully consider your personal risk tolerance, and consult independent professional advice if necessary.


