PID:全球領先的股息增長ETF
總結
- PID是一隻不含美國股息的全球增長型ETF。
- 加拿大佔資產價值的56%。
- 最重要的板塊是公用事業和金融。
- 自2016年以來,PID一直擊敗其競爭對手。
PID策略與投資組合
The Invesco International Dividend Achievers ETF(納斯達克指數:PID)自2005年9月15日以來一直跟蹤納斯達克國際股息成就指數。截至發稿時,該公司持有47只股票,12個月分配收益率爲3.65%,總費用比率爲0.53%。
如招股說明書所述,標的指數選擇的公司如下:
- 在美國上市,在某些情況下在倫敦的倫敦證券交易所上市。
- 在美國和其他受益國家註冊。
- 過去的五年裏每年都增加了年度股息。
- 日均美元交易量至少爲100萬美元。
- 未簽訂導致不符合條件的協議或程序。
加權方法基於12個月股息收益率,每個成分的最大權重爲4%。該指數每年3月重新編制一次,每季度重新平衡一次。任何成分如不符合資格,可在任何時候被排除在外。在這種情況下,直到下一次重組它才被替換。我會提供在發生公司事件(股票分割、併購、拆分……)時保證指數完整性的細節。
到目前爲止,加拿大是權重最大的國家,約佔資產價值的56%;英國僅爲11%,屈居第二;其他國家低於5%,這種集中度是紐約或倫敦上市要求的結果。與其他國際股息增長基金如先鋒國際股息增值ETF (VIGI)相比,這是一個強大的限制。下圖描繪了排名前10的國家,總權重爲93%。
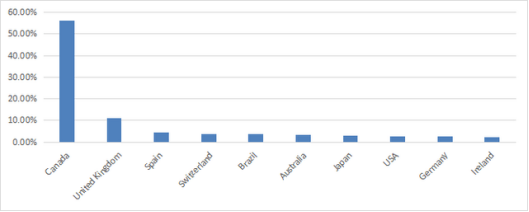
排名前兩位的行業是公用事業(20.5%)和金融(16.8%)。其他行業低於11%。

以下列出的前十大成分股(收益率和其他比率)佔資產價值的37%,最重的權重小於5%,個股風險適中。
與過去最接近的競爭對手相比
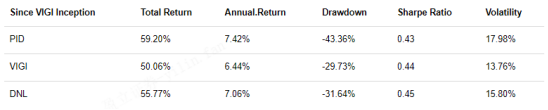
下一個表格將該基金的業績和風險指標與兩隻國際股息增長基金(不包括美國)進行了比較:WisdomTree Global(美國除外)。優質股息增長ETF (DNL)和先鋒國際股息增值ETF (Vanguard International Dividend Appreciation ETF),後者於2016年2月成立。從年化收益率來看,PID以較短的保證金獲勝(比DNL早36個基點),但從最大跌幅和波動性(月收益的標準差)來看,它顯示出顯著更高的風險。
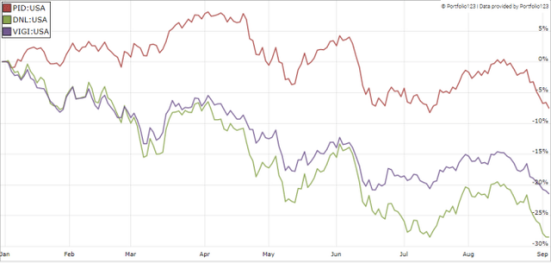
PID也是年初至今的贏家(見下圖)。
PID與國際高收益ETF的對比
下一個圖表對比了PID與今年迄今爲止的四支高收益全球ETF:第一信託道瓊斯全球精選股息ETF (FGD), SPDR標準普爾全球股息ETF (WDIV),全球X超級股息ETF (SDIV)和嘉信理財國際股息股票ETF (SCHY),PID再次領跑。
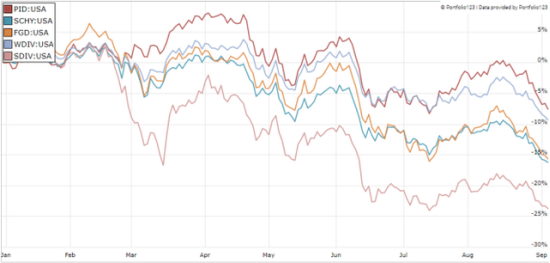
SDIV收益率最高,表現最差,再次顯示出高收益基金的風險。我曾在幾篇ETF評論中指出,收益率超過6%的證券都會遭受資本衰退(很少有例外)。
PID持有47只國際股息增長股票,超過一半的資產價值投資於加拿大公司,公用事業和金融是最重的板塊。自2016年到2022年至今,PID已經擊敗了其國際股息增長競爭對手DLN和VIGI。然而,波動和下降表明風險更高。今年,PID的業績也超過了高收益基金。爲了提高透明度,我的股票投資中以股息爲導向的部分被分成了被動式ETF配置和積極管理的穩定性投資組合(14只股票),在量化風險與價值中進行了披露和更新。
Follow us
Find us on
Facebook,
Twitter ,
Instagram, and
YouTube or frequent updates on all things investing.Have a financial topic you would like to discuss? Head over to the
uSMART Community to share your thoughts and insights about the market! Click the picture below to download and explore uSMART app!

Disclaimers
uSmart Securities Limited (“uSmart”) is based on its internal research and public third party information in preparation of this article. Although uSmart uses its best endeavours to ensure the content of this article is accurate, uSmart does not guarantee the accuracy, timeliness or completeness of the information of this article and is not responsible for any views/opinions/comments in this article. Opinions, forecasts and estimations reflect uSmart’s assessment as of the date of this article and are subject to change. uSmart has no obligation to notify you or anyone of any such changes. You must make independent analysis and judgment on any matters involved in this article. uSmart and any directors, officers, employees or agents of uSmart will not be liable for any loss or damage suffered by any person in reliance on any representation or omission in the content of this article. The content of the article is for reference only and does not constitute any offer, solicitation, recommendation, opinion or guarantee of any securities, virtual assets, financial products or instruments. Regulatory authorities may restrict the trading of virtual asset-related ETFs to only investors who meet specified requirements. Any calculations or images in the article are for illustrative purposes only.
Investment involves risks and the value and income from securities may rise or fall. Past performance is not indicative of future performance. Please carefully consider your personal risk tolerance, and consult independent professional advice if necessary.


