高通多元化戰略初見成效
作者 | 美股研習社
數據支持 | 勾股大數據(www.gogudata.com)

高通4月27日盤後發佈業績、指引雙超預期的財報,反映其手機基本盤在智能手機大幅砍單之下仍未遭受較大沖擊,同時,超預期指引顯示高通發力射頻前端、汽車和物聯網三大領域的多元化發展戰略已取得初步成效。財報發佈以來股價累計上漲5.1%。
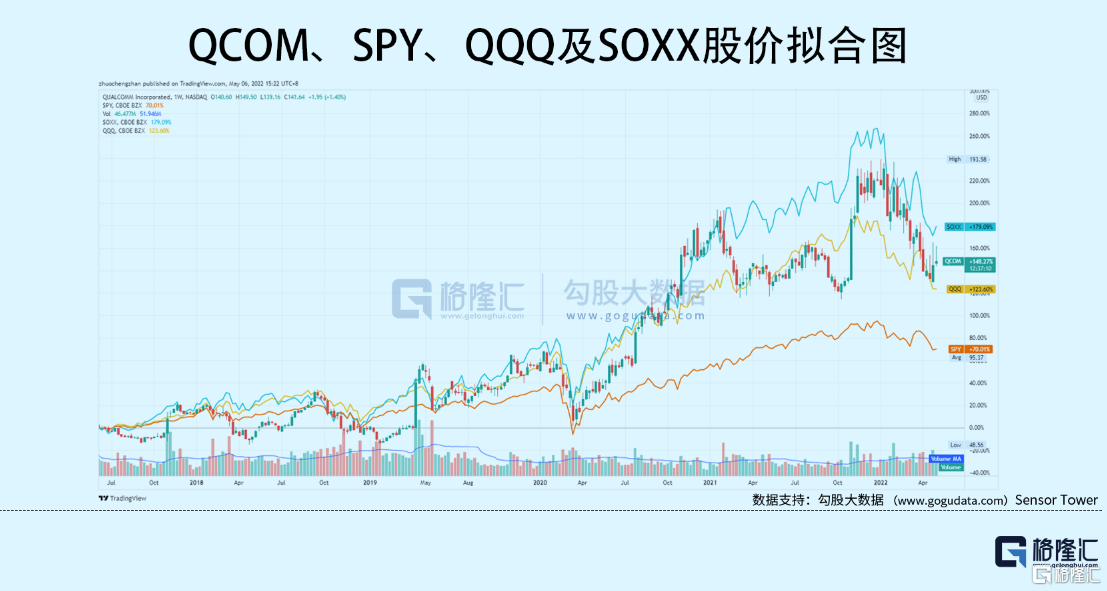
高通 21年全年漲幅為18.98%,22年至今漲幅為-19.47%,跑輸同期標普500指數ETF(SPY:-11.66%),跑贏同期納指100ETF(QQQ:-20.44%)及費城半導體指數(SOXX:-22.87%)。
01 財報詳解:營收、EPS超預期
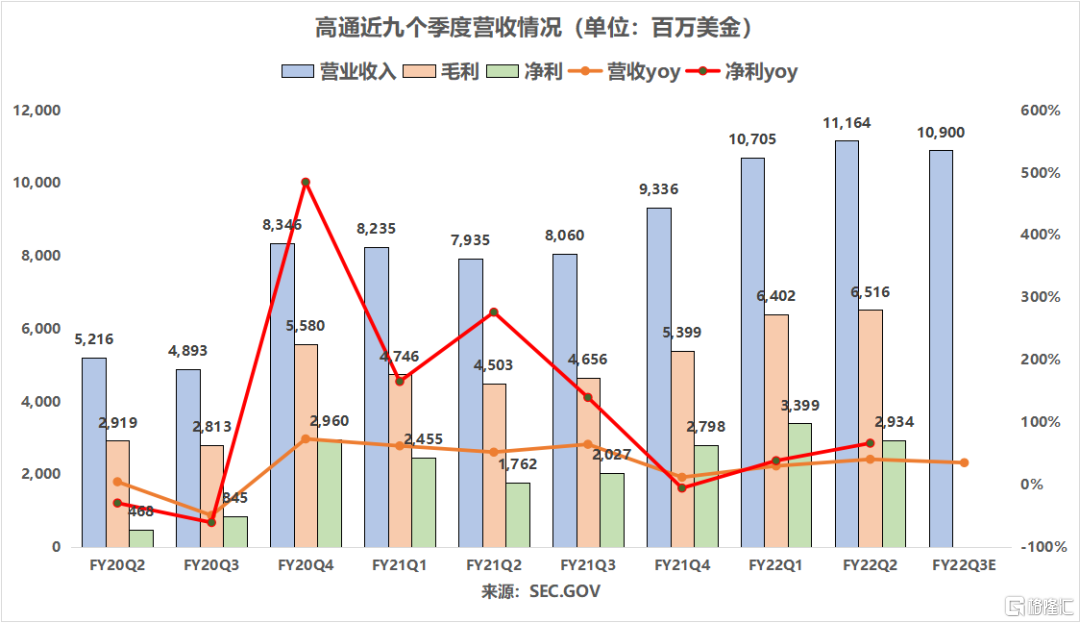
從整體來看,高通FY22Q2調整後營收同比增長40.7%至111.64億美元(指引102-110億美元,預期106億美元),調整後EPS同比增長68.9%至3.21美元(指引2.8-3美元,預期2.93美元)。
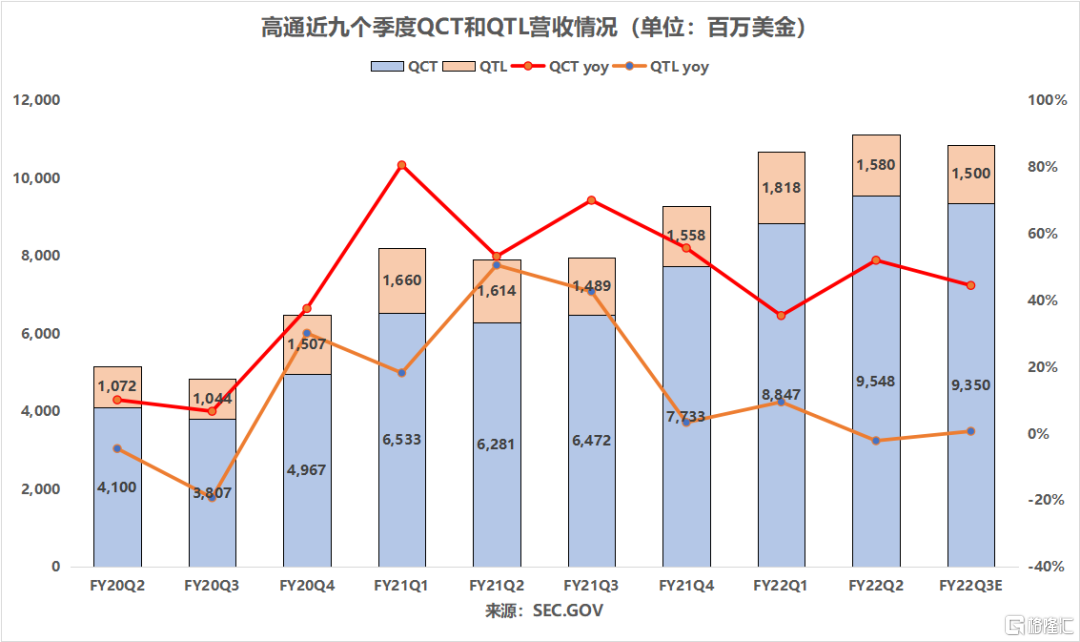
分業務來看:芯片業務QCT營收同比增長52%至95.5億美元(預期88.6億美元),技術許可部門QTL營收同比下降2%至15.8億美元(預期15.5億美元)。
本季度,高通在四個主要芯片市場保持強勁增長(YoY:智能手機+55.6%、射頻前端+28.5%、汽車+41.3%、物聯網+60.7%)。


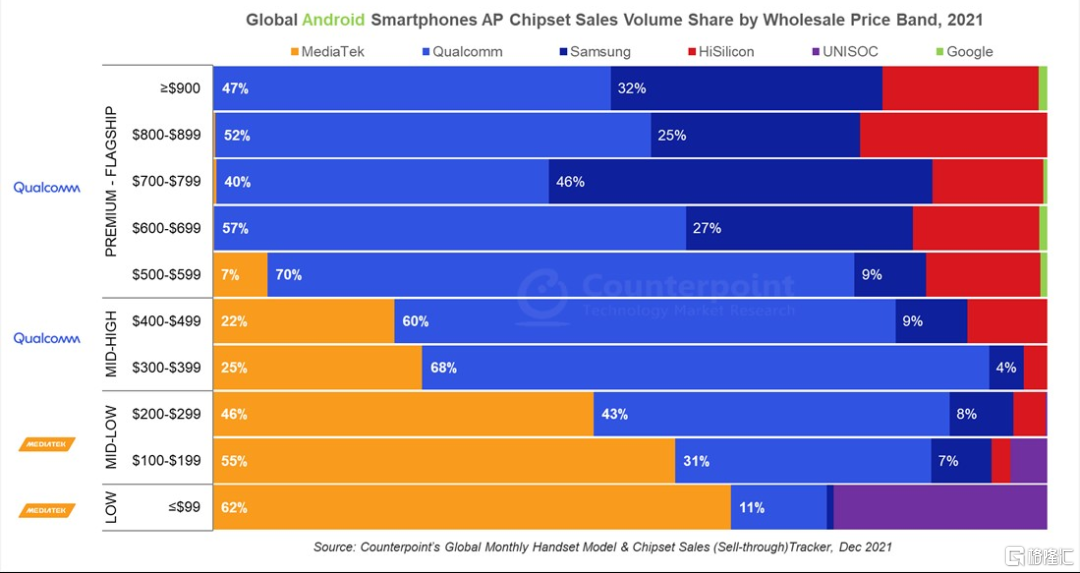
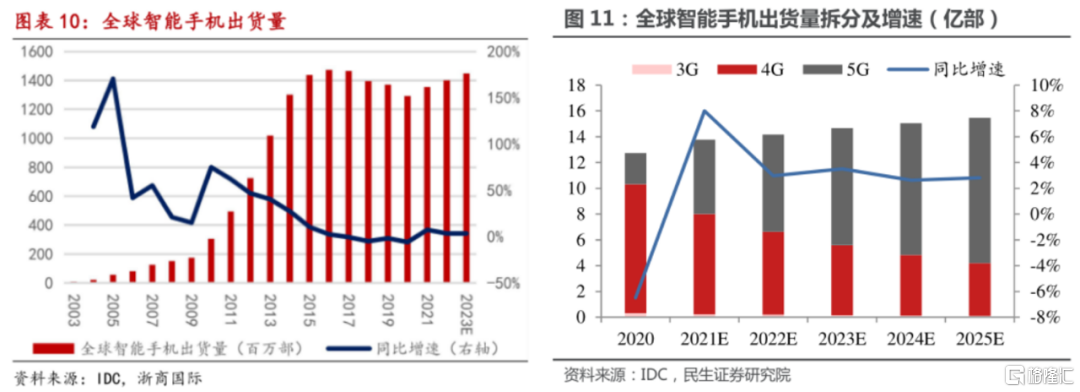
02 趨勢:智能手機存量競爭將愈發激烈
智能手機芯片營收同比增長55.6%至63.25億美元。其中,Snapdragon(驍龍)仍然是高端 Android 的首選移動技術平台。另外,高通承包了三星 Galaxy S22 智能手機高端處理器約 75%的芯片訂單,高於 Galaxy S21 的約 40%。高端智能手機市場銷量的增長,是本季高通手機芯片業務超預期增長的主要推動力,但隨着全球智能手機出貨量趨於穩定,高通與聯發科的存量競爭將愈發激烈。
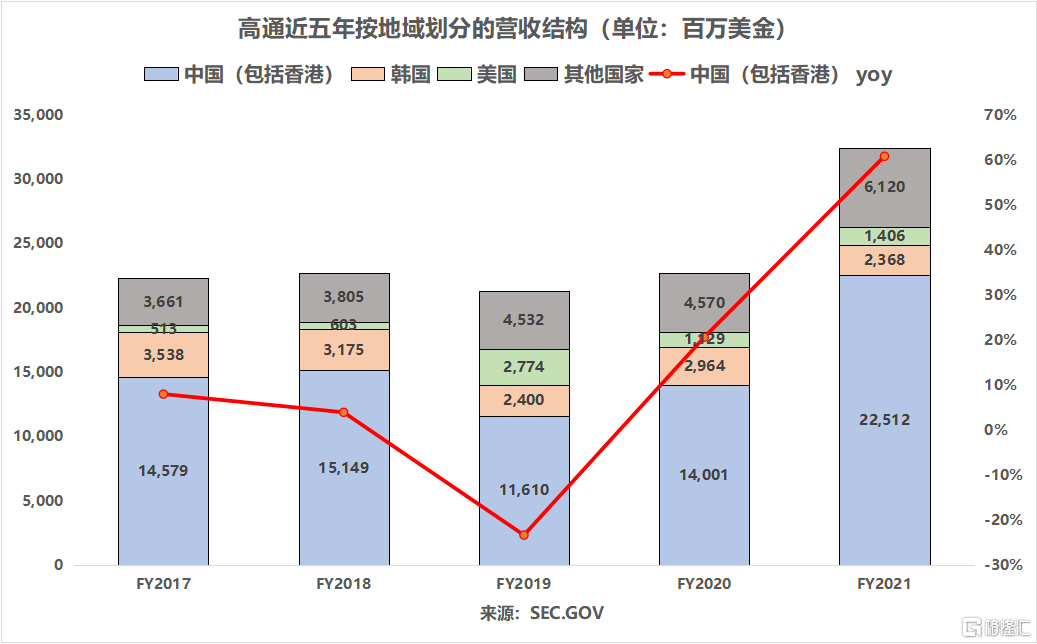
郭明錤此前(4月5日)曾爆料稱,中國主要安卓手機品牌今年砍單1.7億部(佔22年原出貨計劃的20%),如果消費者消費信心繼續走低,未來幾個月訂單可能會再次減少,連帶的是Skyworks和Qorvo射頻前端芯片的庫存水平已超過6-9個月。由於高通主要營收來源於中國,砍單20%之下,高通手機業務或將遭受衝擊。

03 多元化發展戰略初見成效
專注於無線連接所需芯片的射頻前端部門營收同比增長28.5%至11.6億美元。未來,高通打算將在手機領域積累的技術,平移和複製到汽車和物聯網領域,從而推動多元化發展戰略的發展,進而打開公司中長期成長空間。
車用芯片營收同比增長41.3%達3.39億美元,雖然目前高通在汽車市場領域的銷售額相對較小,但公司認為與汽車製造商和供應商達成的合作關係,將推動車用市場營收的進一步增長(不包括本季度完成收購的Veoneer的收入)。
此前,高通與寶馬、汽車製造商及出行方案提供者Stellantis 集團達成深度合作,強強聯手之下,再加上4月1日完成對Veoneer旗下負責ADAS等技術開發的Arriver的46億美元全現金收購,高通先發優勢將更加顯著,汽車業務營收有望進一步提升。截至22年4月,高通在手汽車業務訂單較上季增長超30億美元,達160億美元。
由於對邊緣連接和高級處理的持續需求,本季度專注於低功耗低成本芯片的物聯網部門營收同比增長60.7%至17.24億美元。其中,消費者、邊緣網絡和工業領域表現強勁,每個領域均同比增長超過了50%。值得注意的是,倉儲、物流和醫療保健行業以及機器人平台對加固型手持設備的需求加速增長,物聯網或將率先成為高通營收的第二增長曲線。


04 結語
展望未來,管理層指引大幅超預期:高通預計FY22Q3銷售額為105-113億美元(預期99.8億美元)。其中,QCT營收為91-96億美元(受高端智能手機市場銷量增長、物聯網和汽車強勁需求以及供應改善的推動),EBT利潤率為31%至33%;QTL的收入為14-16億美元,EBT的利潤率為69%-73%。調整後EPS為2.75-2.95美元(預期2.60美元)。
最後來看一下估值:當前NTM PE為11.5x,處於5年低位。高端智能手機市場銷量的增長,推動本季高通營收超預期,估值有一定修復空間,但後續估值的拔高還有賴於第二增長曲線(目前體量都還比較小)。

Follow us
Find us on
Facebook,
Twitter ,
Instagram, and
YouTube or frequent updates on all things investing.Have a financial topic you would like to discuss? Head over to the
uSMART Community to share your thoughts and insights about the market! Click the picture below to download and explore uSMART app!

Disclaimers
uSmart Securities Limited (“uSmart”) is based on its internal research and public third party information in preparation of this article. Although uSmart uses its best endeavours to ensure the content of this article is accurate, uSmart does not guarantee the accuracy, timeliness or completeness of the information of this article and is not responsible for any views/opinions/comments in this article. Opinions, forecasts and estimations reflect uSmart’s assessment as of the date of this article and are subject to change. uSmart has no obligation to notify you or anyone of any such changes. You must make independent analysis and judgment on any matters involved in this article. uSmart and any directors, officers, employees or agents of uSmart will not be liable for any loss or damage suffered by any person in reliance on any representation or omission in the content of this article. The content of the article is for reference only and does not constitute any offer, solicitation, recommendation, opinion or guarantee of any securities, virtual assets, financial products or instruments. Regulatory authorities may restrict the trading of virtual asset-related ETFs to only investors who meet specified requirements. Any calculations or images in the article are for illustrative purposes only.
Investment involves risks and the value and income from securities may rise or fall. Past performance is not indicative of future performance. Please carefully consider your personal risk tolerance, and consult independent professional advice if necessary.


