浙商策略:從股息率視角看當前A股
本文來自:王楊策略研究,作者:王楊 陳昊
摘要
投資要點
近期A股進入2021年年報披露期,分紅派息成為市場關注的焦點,目前A股整體、分行業和公司的股息率情況如何?
1、近期A股股息率上升
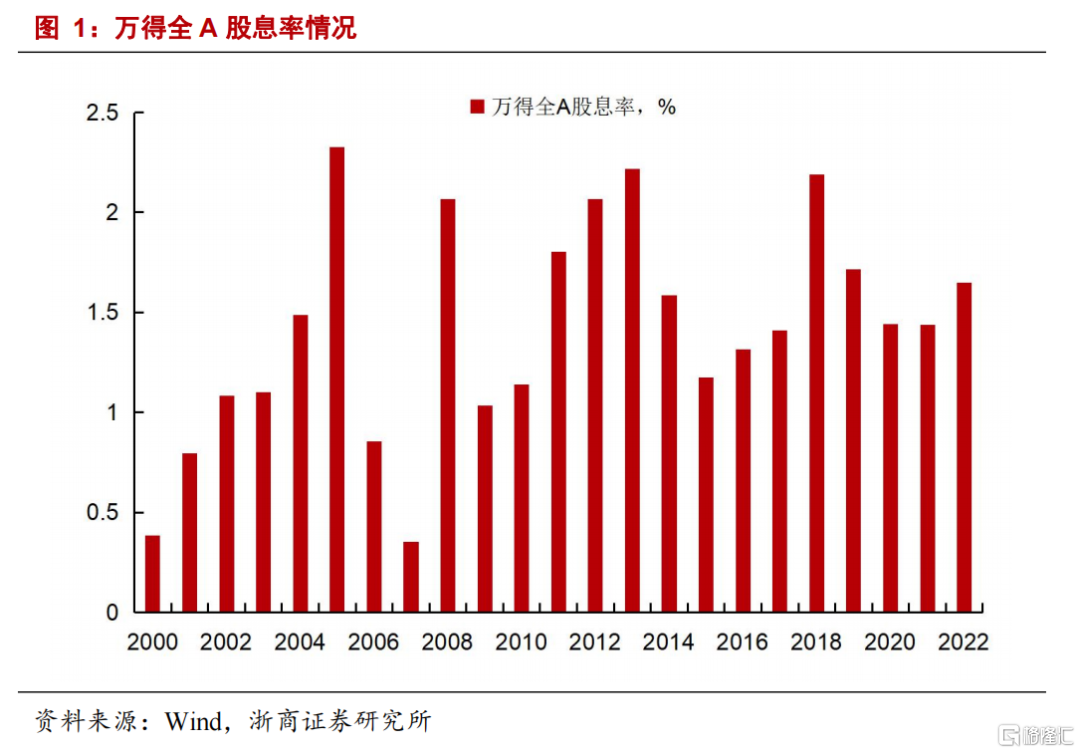
2021年萬得全A股息率較去年上升。2000-2010年,萬得全A的股息率中樞接近1.2%,而2010年後,萬得全A的股息率中樞提升至1.6%左右的水平,2021年股息率為1.65%,較去年提升0.2個百分點,處歷史較高的水平。
2、高股息的行業和公司
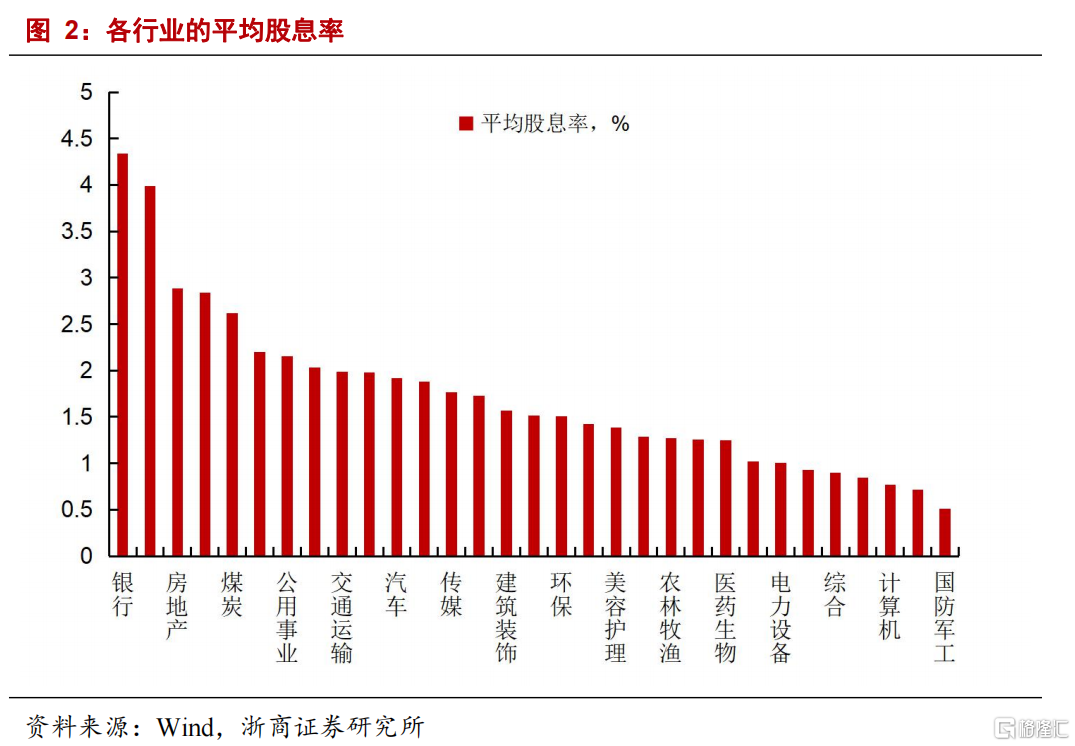
以行業內公司的算術平均值為各行業股息率的統計口徑,從行業分佈上來看,截至3月28日銀行、鋼鐵、房地產行業股息率最高,股息率(近12個月)分別為4.3%、4%和2.9%,其餘行業中,股息率超2%的行業有紡織服飾(2.8%) 、煤炭(2.6%)、家用電器(2.2%)、公用事業(2.2%)、商貿零售(2%)。
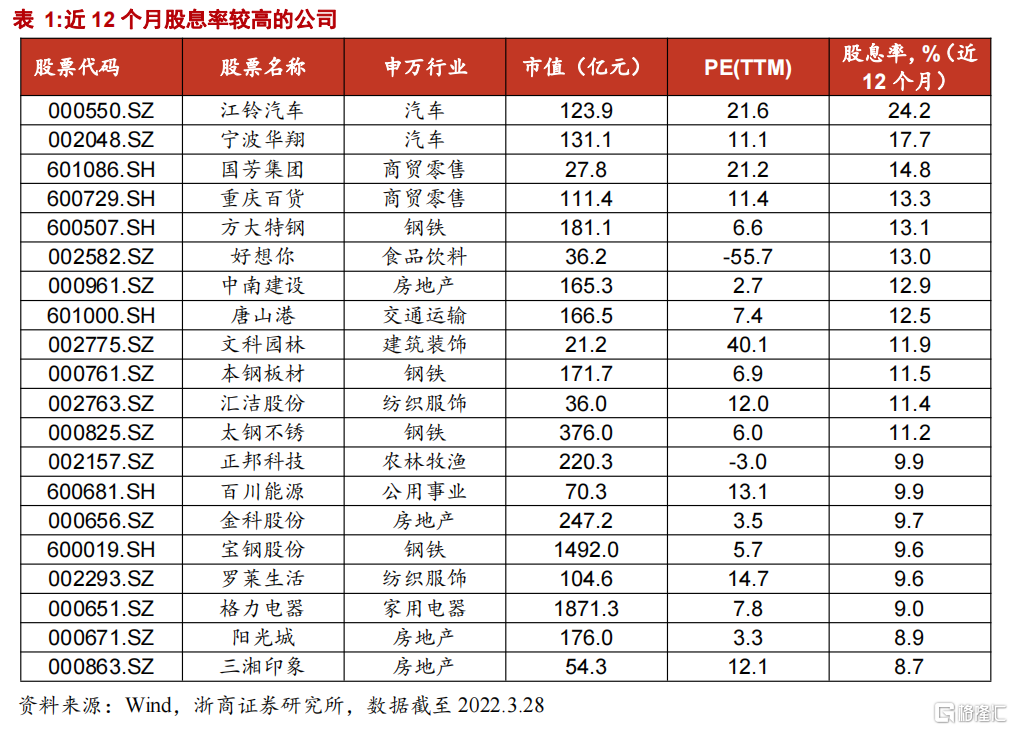
分公司來看,股息率排名前二十大個股的股息率均超8%,股息率排名前十的個股分別為江鈴汽車、寧波華翔、國芳集團、重慶百貨、方大特鋼、好想你、中南建設、唐山港、文科園林、本鋼板材。
3、股息率與A股相關性
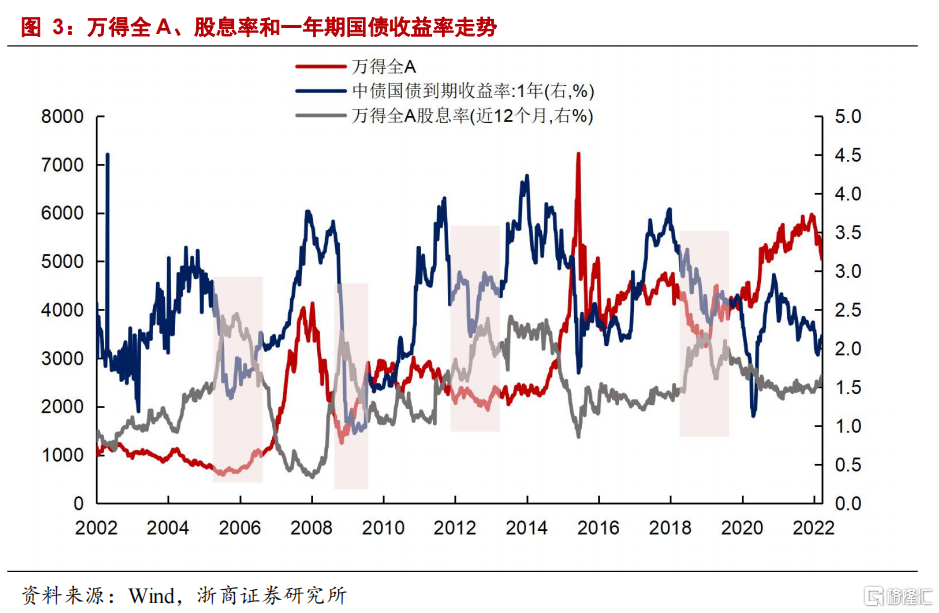
年初以來一年期國債收益率與股息率的利差不斷收窄,從覆盤來看,一年期國債利率與股息率利差收窄往往是市場逐步步入底部區域的信號。
回顧歷史,自2002年以來,A股市場共出現4輪一年期國債利率與萬得全A的股息率收窄的時期,分別為2005年8月-2006年5月、2008年11月-2009年2月、2012年5月-2012年11月和2018年5月-2018年12月,這四個時間段中A股逐步進入底部區域。
這一現象背後的原因或是當股息率接近或高於債券利率,股市的吸引力提升,股票資產的配置價值提升。年初起,萬得全A的股息率與一年期國債利率之差從0.75%跌至0.5%,已接近上一輪利差的低點,股債性價比優勢顯現。
風險提示:俄烏衝突進一步惡化;分紅派息力度不及預期。
正文
1、近期A股股息率上升
近期為A股2021年年報的披露期,分紅派息成為市場關注的焦點。已公佈派現方案公司中,多家公司股息率超過5%,受到市場關注。
2021年萬得全A股息率較去年上升。2000-2010年,萬得全A的股息率中樞接近1.2%,而2010年後,萬得全A的股息率中樞提升至1.6%左右的水平,2021年股息率為1.65%,較去年提升0.2個百分點,處歷史較高的水平。
2、高股息的行業和公司
以行業內公司的算術平均值為各行業股息率的統計口徑,從行業分佈上來看,截至3月28日銀行、鋼鐵、房地產行業股息率最高,股息率(近12個月)分別為4.3%、4%和2.9%,其餘行業中,股息率超2%的行業有紡織服飾(2.8%) 、煤炭(2.6%)、家用電器(2.2%)、公用事業(2.2%)、商貿零售(2%)。
分公司來看,截至2022年3月28日,股息率(近12個月)排名前二十大個股的股息率均超8%,排名前十的個股分別為江鈴汽車、寧波華翔、國芳集團、重慶百貨、方大特鋼、好想你、中南建設、唐山港、文科園林、本鋼板材等。
3、股息率與A股相關性
年初以來一年期國債收益率與股息率的利差不斷收窄,從覆盤來看,一年期國債利率與股息率利差收窄往往是市場逐步步入底部區域的信號。
回顧歷史,自2002年以來,A股市場共出現4輪一年期國債利率與萬得全A的股息率收窄的時期,分別為2005年8月-2006年5月、2008年11月-2009年2月、2012年5月-2012年11月和2018年5月-2018年12月,這四個時間段中A股逐步進入底部區域。
這一現象背後的原因或是當股息率接近或高於債券利率,股市的吸引力提升,股票資產的配置價值提升。年初起,萬得全A的股息率與一年期國債利率之差從0.75%跌至0.5%,已接近上一輪利差的低點,股債性價比優勢顯現。
4、 風險提示
1、俄烏衝突進一步惡化。
2、分紅派息力度不及預期。
Follow us
Find us on
Facebook,
Twitter ,
Instagram, and
YouTube or frequent updates on all things investing.Have a financial topic you would like to discuss? Head over to the
uSMART Community to share your thoughts and insights about the market! Click the picture below to download and explore uSMART app!

Disclaimers
uSmart Securities Limited (“uSmart”) is based on its internal research and public third party information in preparation of this article. Although uSmart uses its best endeavours to ensure the content of this article is accurate, uSmart does not guarantee the accuracy, timeliness or completeness of the information of this article and is not responsible for any views/opinions/comments in this article. Opinions, forecasts and estimations reflect uSmart’s assessment as of the date of this article and are subject to change. uSmart has no obligation to notify you or anyone of any such changes. You must make independent analysis and judgment on any matters involved in this article. uSmart and any directors, officers, employees or agents of uSmart will not be liable for any loss or damage suffered by any person in reliance on any representation or omission in the content of this article. The content of the article is for reference only and does not constitute any offer, solicitation, recommendation, opinion or guarantee of any securities, virtual assets, financial products or instruments. Regulatory authorities may restrict the trading of virtual asset-related ETFs to only investors who meet specified requirements. Any calculations or images in the article are for illustrative purposes only.
Investment involves risks and the value and income from securities may rise or fall. Past performance is not indicative of future performance. Please carefully consider your personal risk tolerance, and consult independent professional advice if necessary.


