釀酒反彈了,能抄底了麼?
本文來自格隆匯專欄:國泰君安證券研究 作者:鄭旭
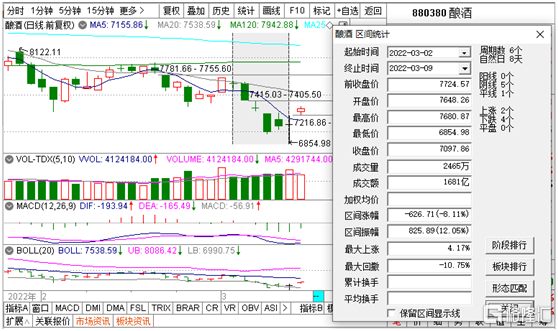
開年至今,釀酒行業已經下跌超過14%,本週釀酒行業指數更是大幅震盪,自3月2日以來,指數累積振幅達到12.05%,尤其在昨日盤中,釀酒行業指數一度跌超近3%後,尾盤又收紅,巨震超5%。今日釀酒行業指數又再度跳漲3.3%。在振幅如此巨大的情況下,釀酒行業指數是否已經可以抄底了?
對於這個問題,我認為可以從兩個維度去看:
從基本面上看,短期有催化。近兩日釀酒指數出現反彈與貴州茅台以及相關公司發佈的1-2月月度數據有關。在3月8日,貴州茅台發佈1-2月經營數據,數據顯示營收及淨利潤雙雙同比增長20%。這個百分之20%是什麼概念呢?去年同期,貴州茅台的一季度增速僅僅6%,二季度增長只有9%,到三季度時有10%,到了全年大概只有11%,到了近期則達到了20%,這説明高端白酒,最起碼貴州茅台的經營情況並沒像市場想的那樣逐步放緩,顯示出了相當的韌性。也許正是因為有該消息的催化,帶動近幾日釀酒行業出現的反彈。
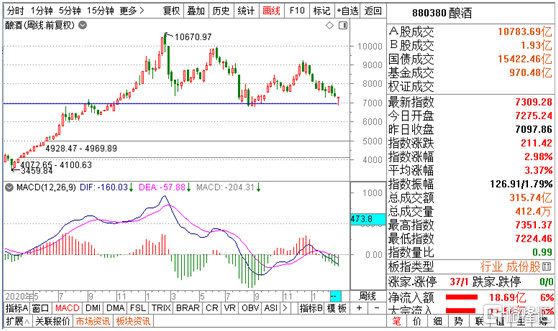
從技術面上來看,位置處於關鍵。釀酒指數目前也處在頸線位置,如下圖所示。在這裏,本來也是一個容易出現反彈的位置。對於釀酒指數來看,也是比較關鍵的位置了,不能輕易去跌破這區間。技術角度説,一個重要的支撐位跌破,容易使得前期堆積的盈利籌碼變為套牢籌碼,使得走勢變得更加困難。好在反彈了,並且還是基本面和技術面的共振形成的反彈。
對於釀酒指數後市走勢,我覺得需要看兩點:
第一,行業年報和季報。隨着年報季和季報季的臨近,越來越多的公司會發布財務數據,財務數據是否可以打消掉市場對於釀酒行業基本面的疑慮,淡化可能的消費税的影響?
第二,資金的動向。由於開年以來的魔幻行情,能看到的是基金髮行的遇冷,基金髮行規模急劇下滑的背後透露出來的是市場風險偏好的快速降低。當市場風險偏好降低的時候,市場到底去選擇用防禦來保證本金,還是用更伶俐的進攻去追逐為數不多的高成長高景氣度行業,可能會是後面一段時間市場的勝負手,只等風來。
畢竟市場一直都在變,比如俄烏戰爭可能改變的是歐洲對於光伏風電的裝機需求?妖“鎳”影響的可能是新能源車的高鎳鋰電池?
短炒靠消息,長拿靠邏輯。最後想分享今天看到的一段話:長線就是先有邏輯再等圖形,中短線就是先有圖形再講邏輯;熊市談價值,牛市談技術。
Follow us
Find us on
Facebook,
Twitter ,
Instagram, and
YouTube or frequent updates on all things investing.Have a financial topic you would like to discuss? Head over to the
uSMART Community to share your thoughts and insights about the market! Click the picture below to download and explore uSMART app!

Disclaimers
uSmart Securities Limited (“uSmart”) is based on its internal research and public third party information in preparation of this article. Although uSmart uses its best endeavours to ensure the content of this article is accurate, uSmart does not guarantee the accuracy, timeliness or completeness of the information of this article and is not responsible for any views/opinions/comments in this article. Opinions, forecasts and estimations reflect uSmart’s assessment as of the date of this article and are subject to change. uSmart has no obligation to notify you or anyone of any such changes. You must make independent analysis and judgment on any matters involved in this article. uSmart and any directors, officers, employees or agents of uSmart will not be liable for any loss or damage suffered by any person in reliance on any representation or omission in the content of this article. The content of the article is for reference only and does not constitute any offer, solicitation, recommendation, opinion or guarantee of any securities, virtual assets, financial products or instruments. Regulatory authorities may restrict the trading of virtual asset-related ETFs to only investors who meet specified requirements. Any calculations or images in the article are for illustrative purposes only.
Investment involves risks and the value and income from securities may rise or fall. Past performance is not indicative of future performance. Please carefully consider your personal risk tolerance, and consult independent professional advice if necessary.


