宋雪濤:各行業擁擠度到了什麼位置?
本文來自格隆匯專欄:天風宏觀宋雪濤 作者:宋雪濤
目前交易擁擠度最高的建築沒有超過80%分位,前期低擁擠板塊(主要是部分價值和金融)的情緒並不極端,由於交易過於擁擠引發調整的概率較低。前期高擁擠板塊(主要是醫藥、電子、基礎化工、電新、軍工)的交易擁擠度已經下降到15%分位以下,短期企穩的概率較高。需要強調的是技術指標只代表市場情緒的狀態,是結果而不是原因,真正的情緒企穩首先需要看到穩增長的兑現,屆時市場短期風格仍會偏向價值,而中期風格切換回成長,還要情緒進一步改善和美債利率回落,時點預計將在2季度後。
上週報吿《情緒的鐘擺到哪兒了》的核心結論是:年初以來的價值風格,並非是向穩增長進攻,而是情緒回落對應的“高擁擠解體”,向低擁擠高股息板塊防禦。板塊輪動由避險情緒主導,市場何時見底要從情緒上找答案,等待地產、基建和疫情出現拐點信號,或者藉助技術指標和歷史經驗的指引。
技術指標是市場價量信號的變體,成交量和交易擁擠度可以表達出市場情緒的狀態(位置和幅度),其中交易擁擠度是用價格走勢體現出的超買超賣特徵來刻畫的,雖然每輪行情的基本面驅動因素不同,但市場情緒和交易環境的變化是相似的。
因此這次我們繼續借助交易擁擠度這個技術指標來觀察各行業當前的市場情緒狀態,並參照歷史規律來判斷當前情緒狀態下,各行業未來走勢的概率分佈。
圖1:中信一級行業當前的交易擁擠度(百分位)
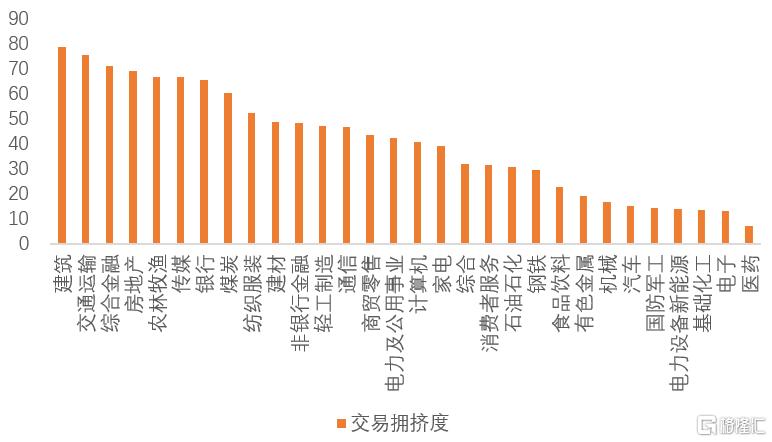
資料來源:Wind,天風證券研究所
目前30箇中信一級行業的交易擁擠度的平均值為40%分位,市場整體情緒偏悲觀。
擁擠度排名前五的行業是:建築(78%分位)、交通運輸(75%分位)、綜合金融(71%分位)、房地產(69%分位)和農林牧漁(66%分位)。
擁擠度排名後五的行業是:醫藥(7%分位)、電子(13%分位)、基礎化工(13%分位)、電新(14%分位)和軍工(14%分位)。(見圖1)
圖2:交易擁擠度下降到15%以下之後,30個一級行業的收益率均值頻數分佈
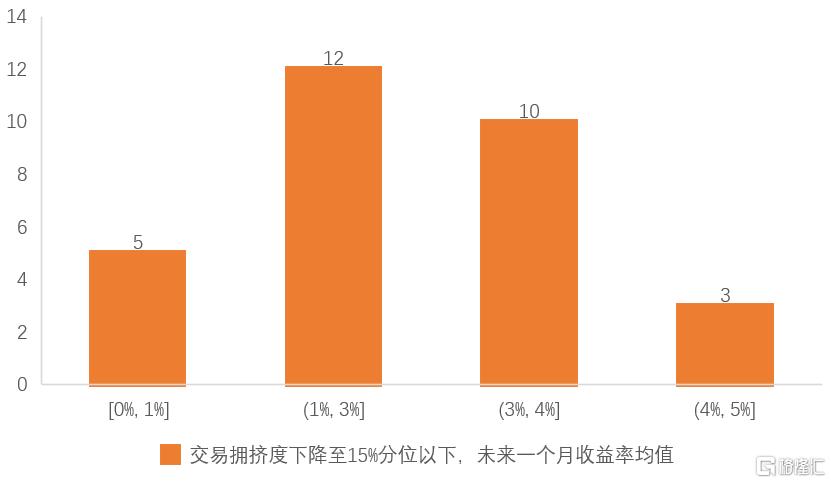
資料來源:天風證券研究所
我們統計了2010年以來中信一級行業在交易擁擠度15%分位以下之後一個月的收益率分佈,發現:
有5個行業未來1個月的收益率均值在0-1%之間,12個行業在1%-3%之間,10個在3%-4%之間,3個行業在4%-5%,分佈明顯右偏。(見圖2)
交易擁擠度低於15%時,各行業收益率中位數的平均值為2.3%,其中軍工、計算機、電新、電子在未來一個月的收益率中位數最高。(見圖3)
交易擁擠度低於15%後,大多數一級行業未來一個月下跌5%以上的概率小於20%(其中3個行業概率小於10%,19個行業概率小於20%,8個行業概率小於30%),企穩的概率很高。(見圖3)
圖3:交易擁擠度下降至15%以下之後,一級行業未來一個月收益率分佈
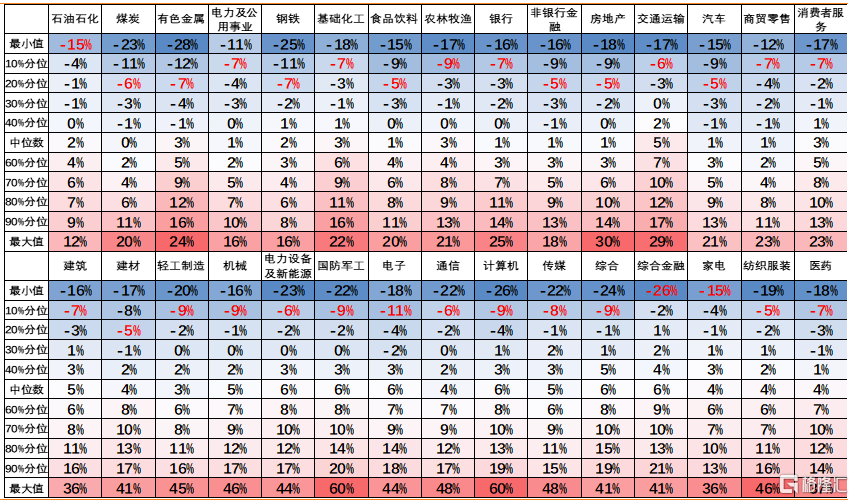
資料來源:天風證券研究所
目前交易擁擠度最高的建築沒有超過80%分位,前期低擁擠板塊(主要是部分價值和金融)的情緒並不極端,由於交易過於擁擠引發調整的風險較低。
前期高擁擠板塊(主要是醫藥、電子、基礎化工、電新、軍工)的交易擁擠度已經下降到15%分位以下,短期企穩的概率較高。
需要強調的是技術指標只代表市場情緒的狀態,是結果不是原因,真正的情緒企穩首先需要看到穩增長的兑現。
屆時市場短期風格仍會偏向價值,而中期風格切換回成長,還要情緒進一步改善和美債利率回落,時點預計將在2季度後。
Follow us
Find us on
Facebook,
Twitter ,
Instagram, and
YouTube or frequent updates on all things investing.Have a financial topic you would like to discuss? Head over to the
uSMART Community to share your thoughts and insights about the market! Click the picture below to download and explore uSMART app!

Disclaimers
uSmart Securities Limited (“uSmart”) is based on its internal research and public third party information in preparation of this article. Although uSmart uses its best endeavours to ensure the content of this article is accurate, uSmart does not guarantee the accuracy, timeliness or completeness of the information of this article and is not responsible for any views/opinions/comments in this article. Opinions, forecasts and estimations reflect uSmart’s assessment as of the date of this article and are subject to change. uSmart has no obligation to notify you or anyone of any such changes. You must make independent analysis and judgment on any matters involved in this article. uSmart and any directors, officers, employees or agents of uSmart will not be liable for any loss or damage suffered by any person in reliance on any representation or omission in the content of this article. The content of the article is for reference only and does not constitute any offer, solicitation, recommendation, opinion or guarantee of any securities, virtual assets, financial products or instruments. Regulatory authorities may restrict the trading of virtual asset-related ETFs to only investors who meet specified requirements. Any calculations or images in the article are for illustrative purposes only.
Investment involves risks and the value and income from securities may rise or fall. Past performance is not indicative of future performance. Please carefully consider your personal risk tolerance, and consult independent professional advice if necessary.


