華西策略:最新A股投資者結構全景圖
本文來自: 策略李立峯與行業配置筆記,作者:華西策略團隊
投資要點
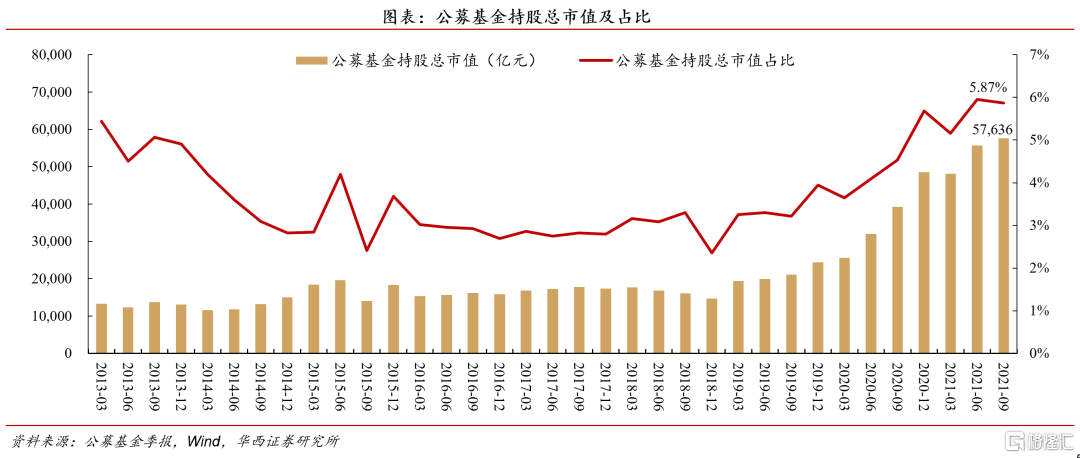
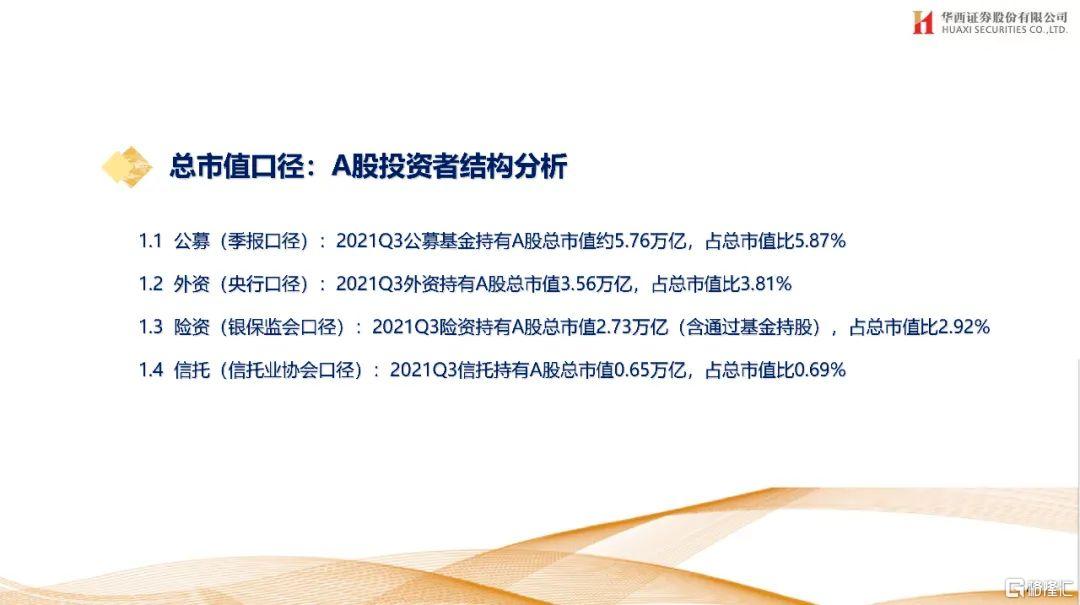
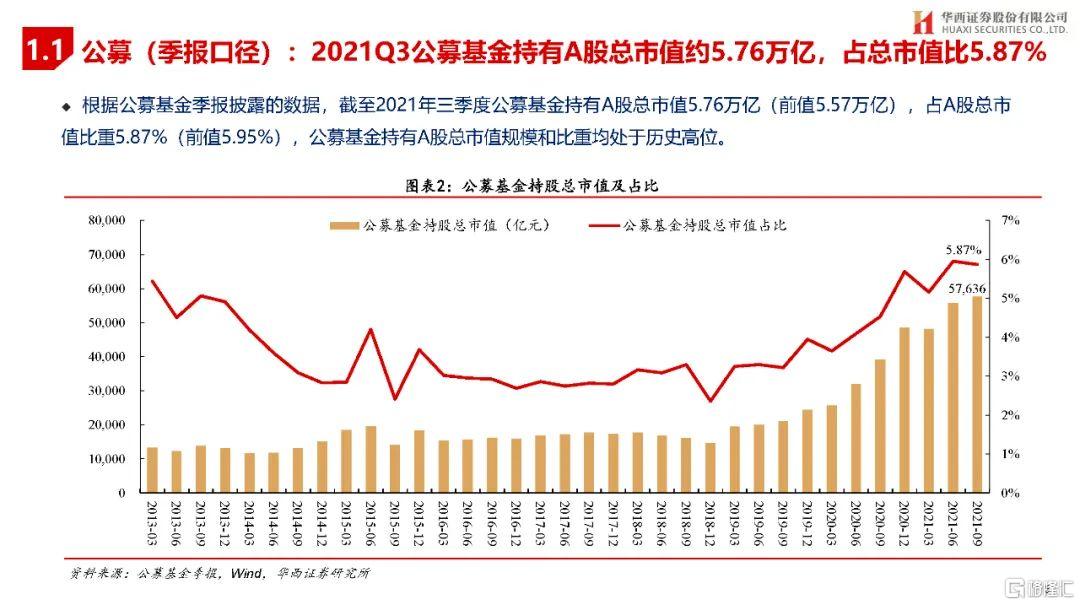
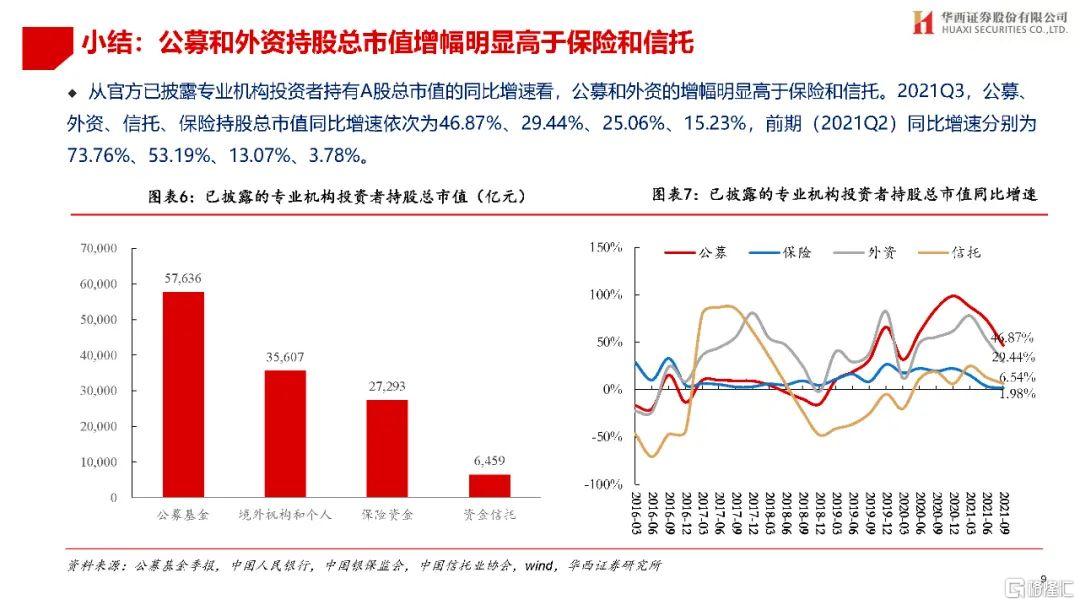
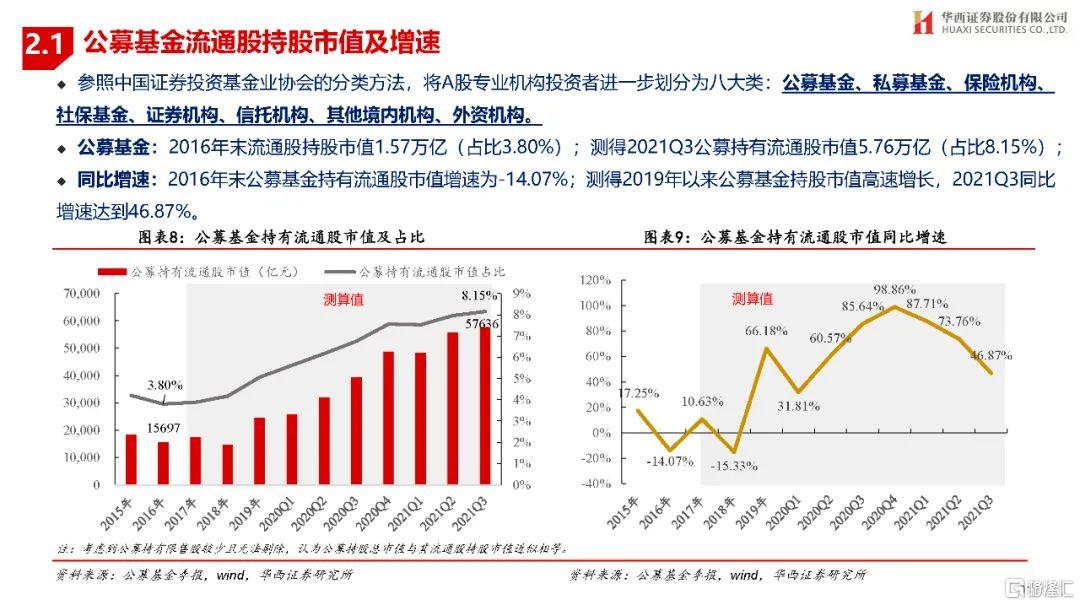
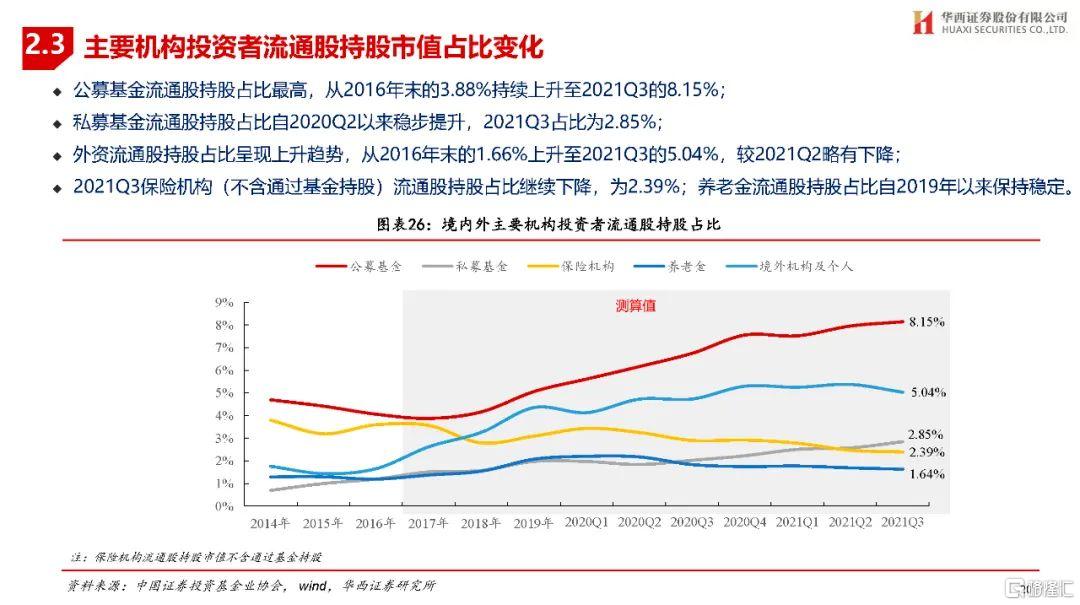
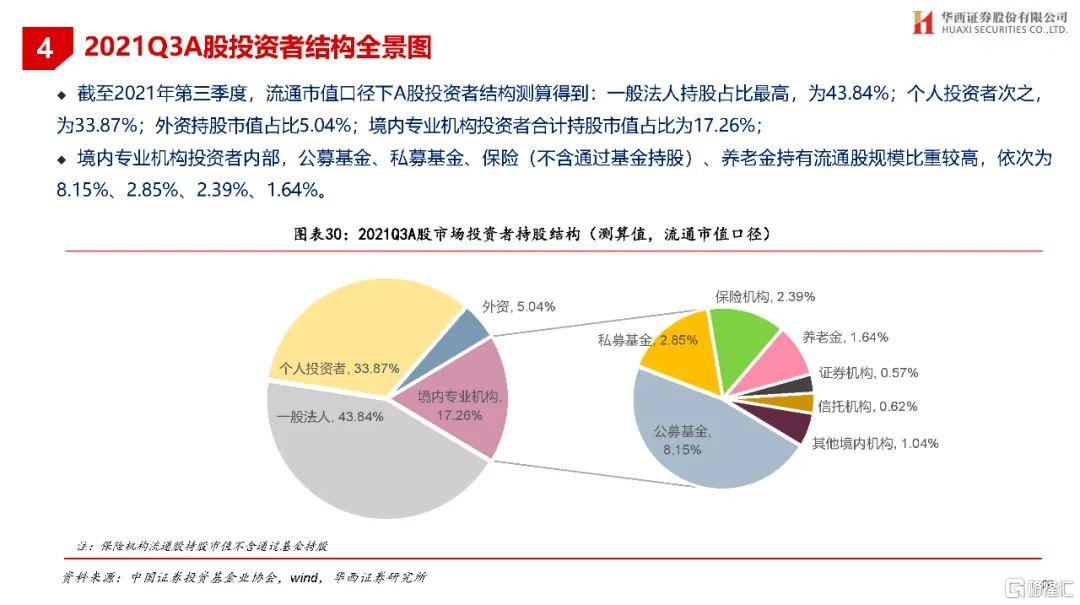
一、公募基金三季度持有A股總市值5.76萬億,佔A股總市值比重為5.87%(前值為5.57萬億,5.95%)。截至2021年三季度,公募基金持有A股總市值5.76萬億,佔A股總市值比為5.87%(前值為5.57萬億,佔比5.95%),持有規模和比重均處於歷史高位。三季度公募基金持股市值保持較快增長,同比增速為46.87%。流通市值口徑下,公募基金仍是持股市值佔比最高的專業機構投資者,三季度佔比8.15%。
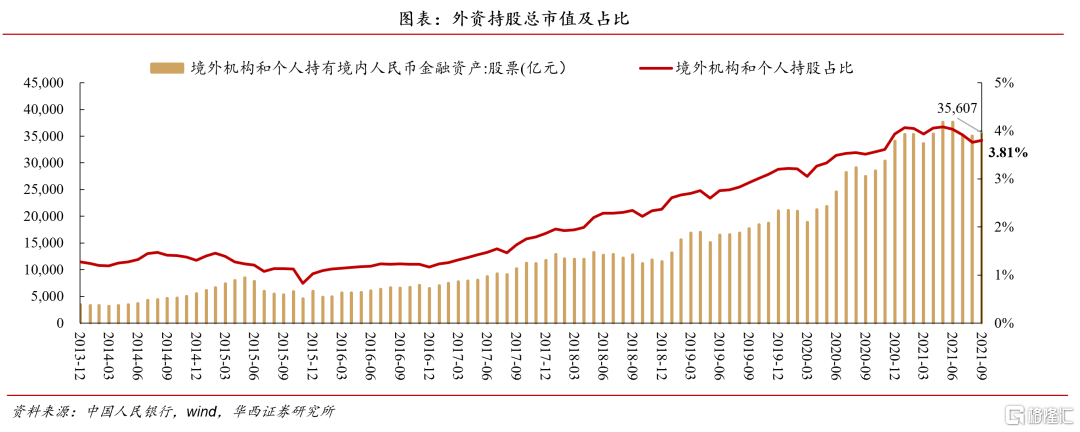
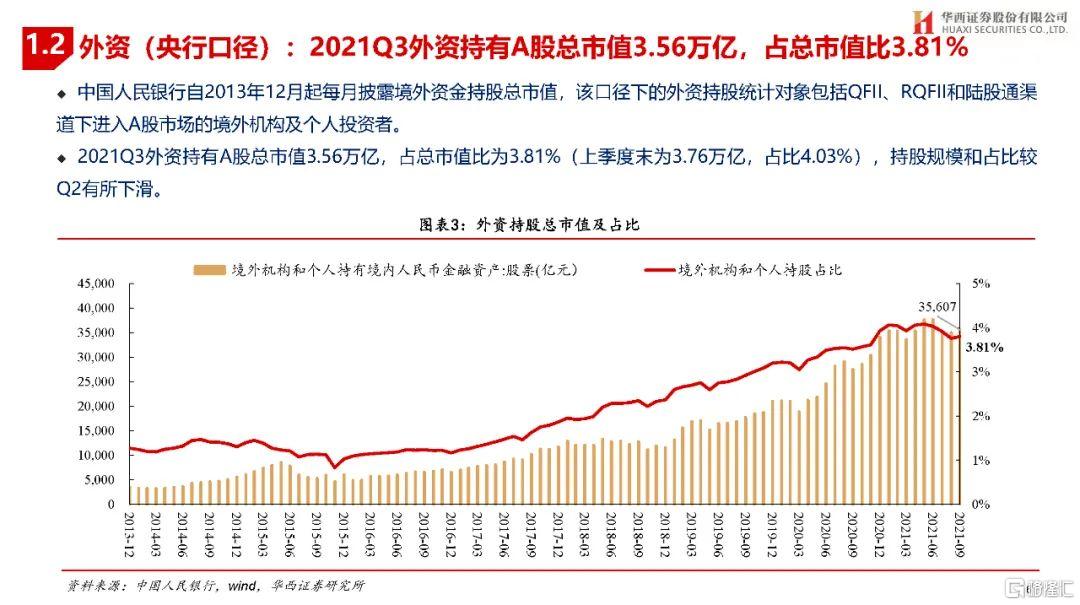
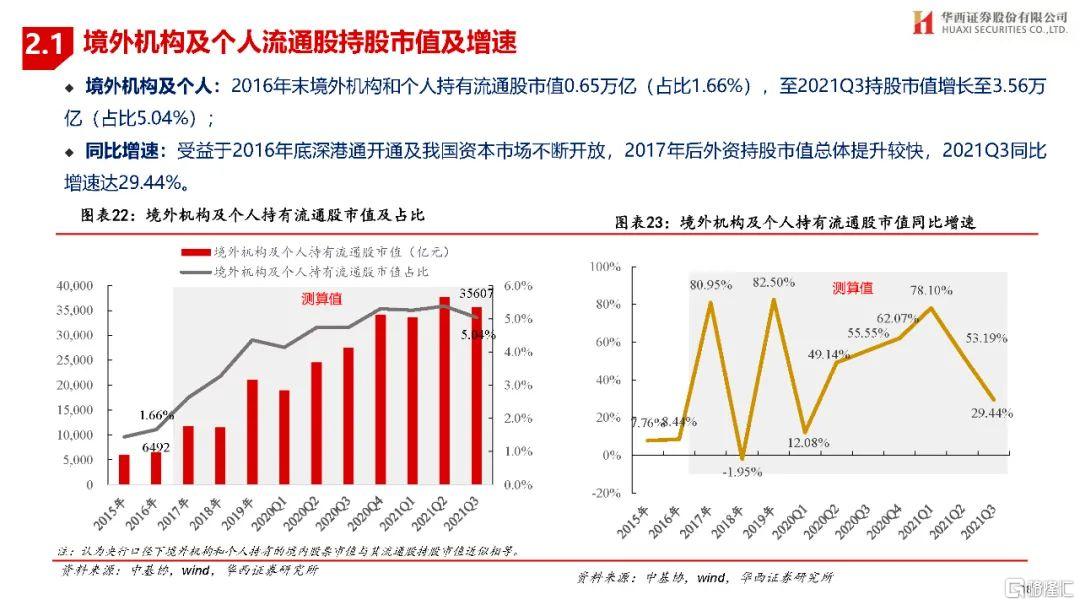
二、外資三季度持有A股總市值3.56萬億,佔總市值比3.81%(上季度末為3.76萬億,佔比4.03%)。截至2021三季度末,境外機構和個人持股總市值為3.56萬億,佔總市值比3.81%,持股規模和佔比較Q2有所下滑。2021Q3外資持股規模同比增速為29.44%(前期53.19%)。流通市值口徑下,受益於我國資本市場不斷開放,外資持股市值佔比呈現上升趨勢,從2016年末的1.66%上升至2021Q1的5.04%。
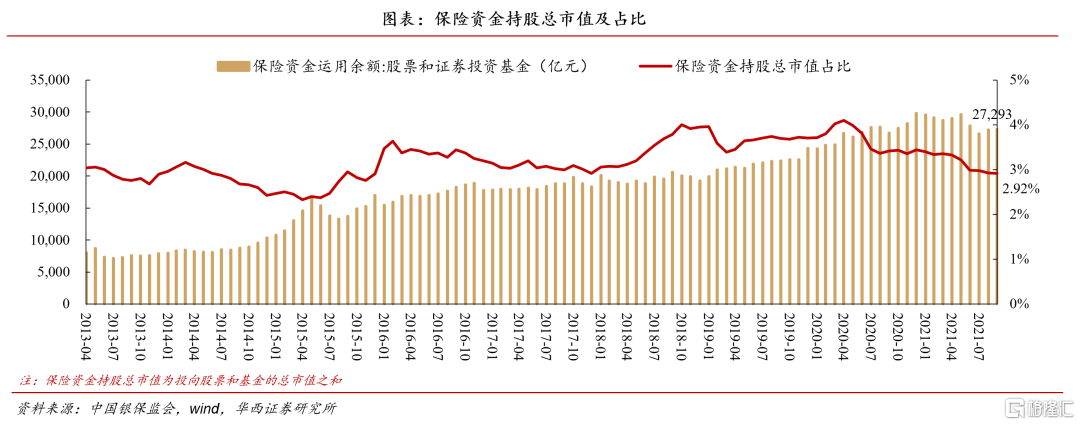
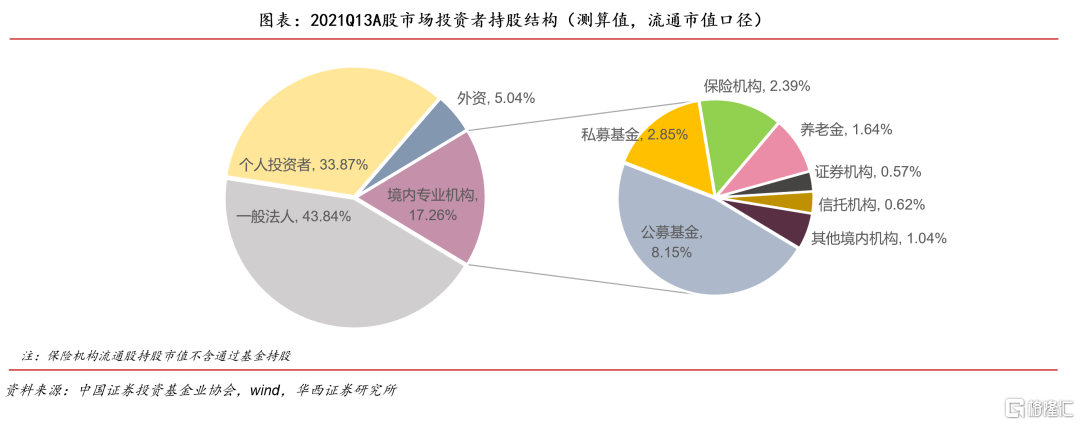
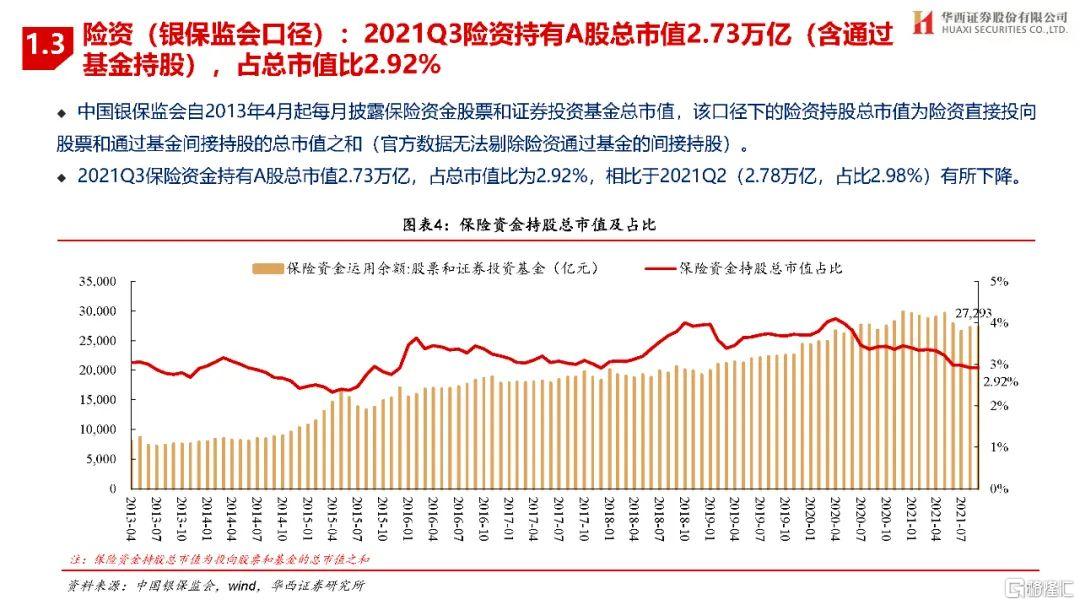
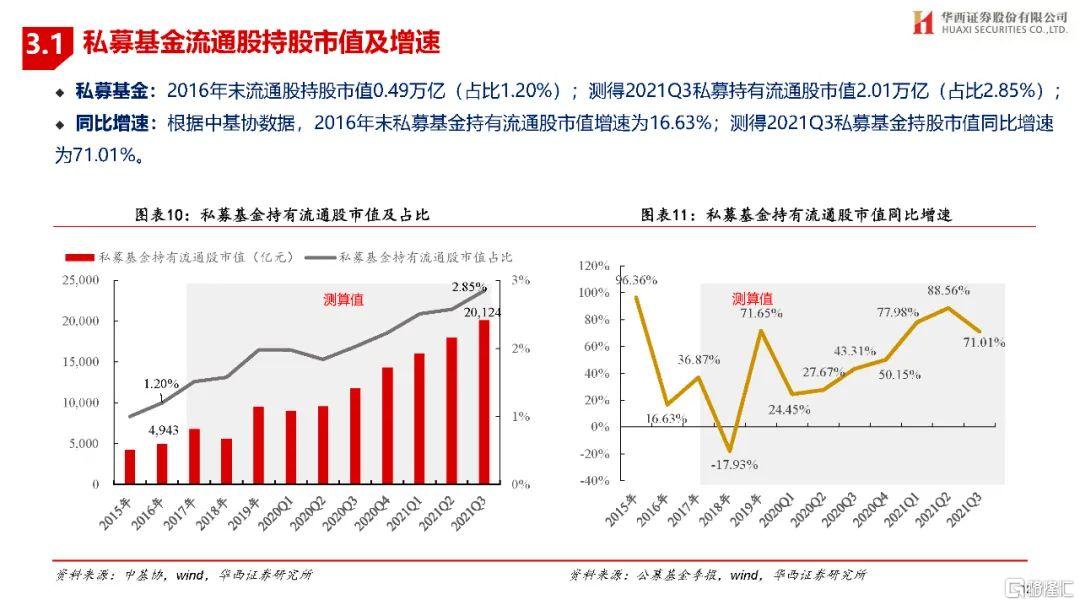
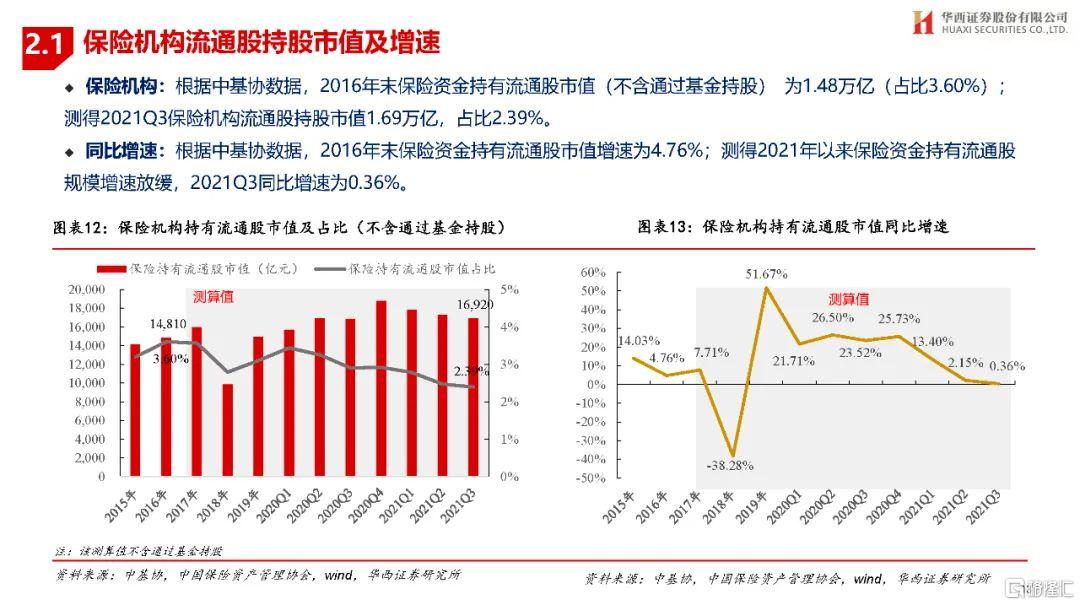
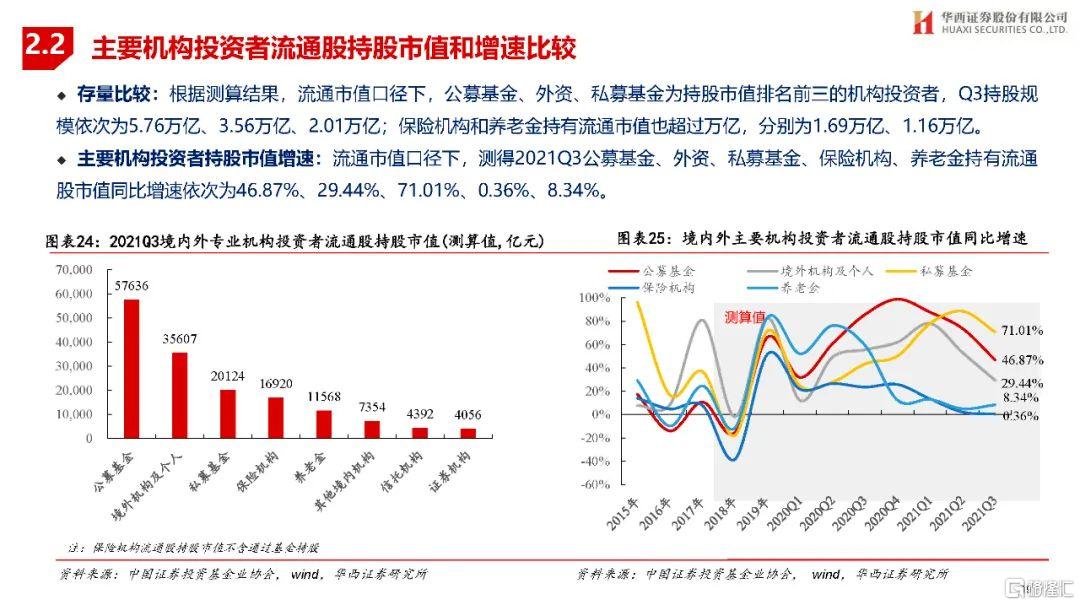
三、流通股市值口徑下,測得三季度末保險資金(不含通過基金持股)、私募基金持股規模分別為1.69萬億(佔比2.39%)、2.01萬億(佔比2.85%)。總市值口徑下,截至2021年三季度末,保險資金股票和證券投資基金總市值達2.73萬億,佔A股總市值的比重為2.92%,相比前期(2.78萬億、佔比2.98%)有所下降。流通市值口徑下,根據我們的測算,2021年三季度保險機構保險資金(不含通過基金持股)、私募基金持股規模分別為1.69萬億(佔比2.39%)、2.01萬億(佔比2.85%)。其中,私募基金持有流通股規模快速增長,已在所有專業機構投資者中位列第三,僅次於公募和外資。
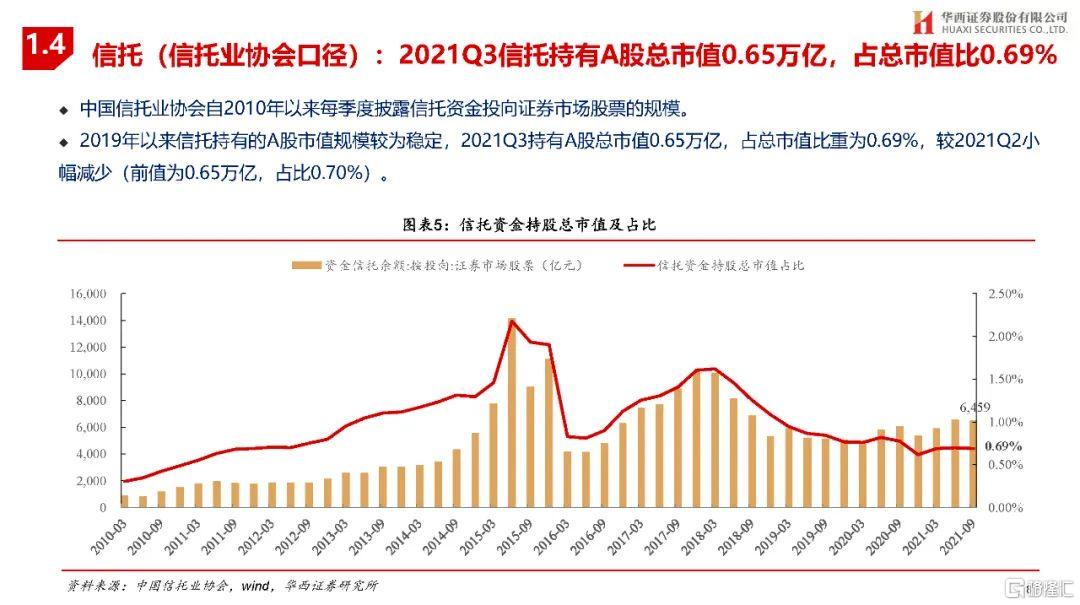
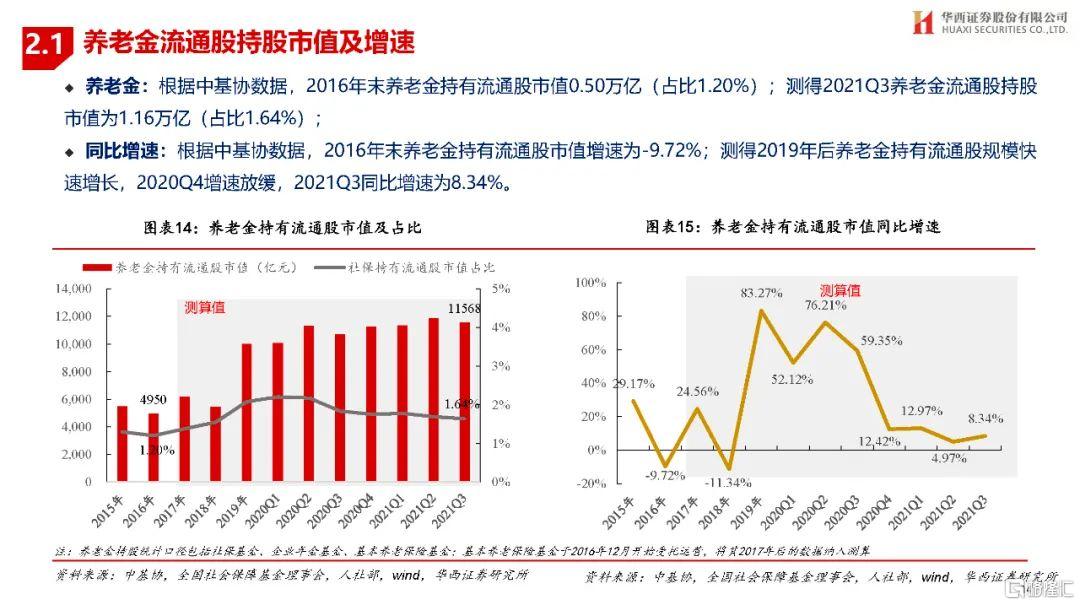
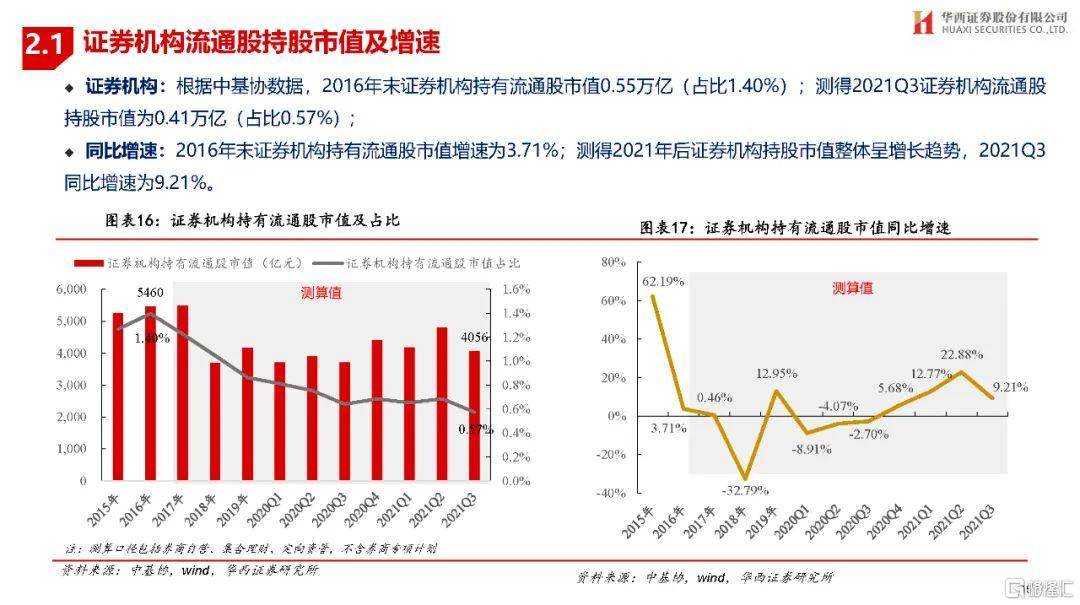
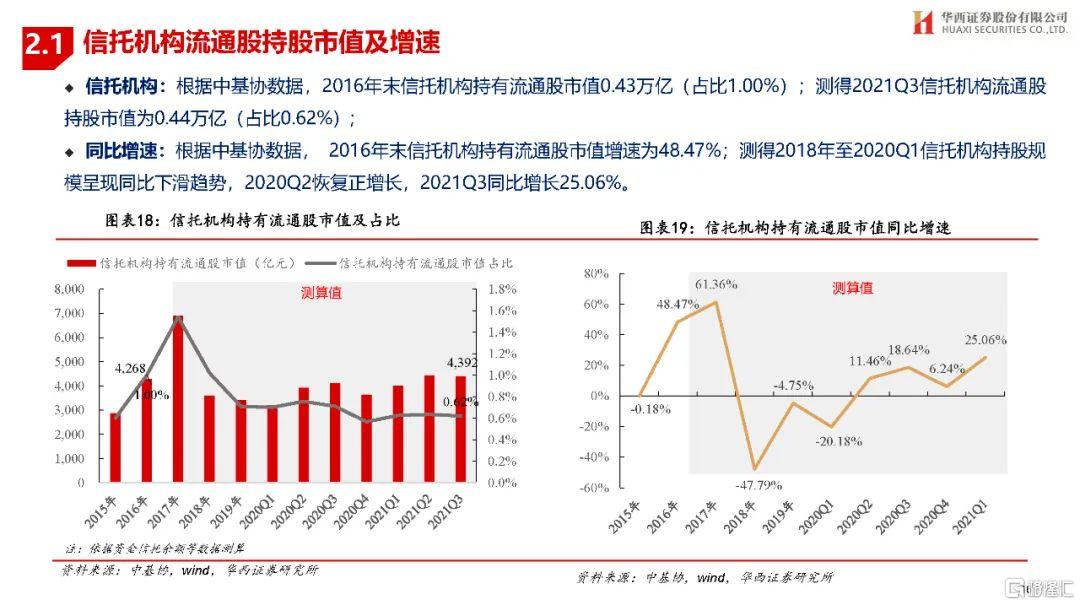
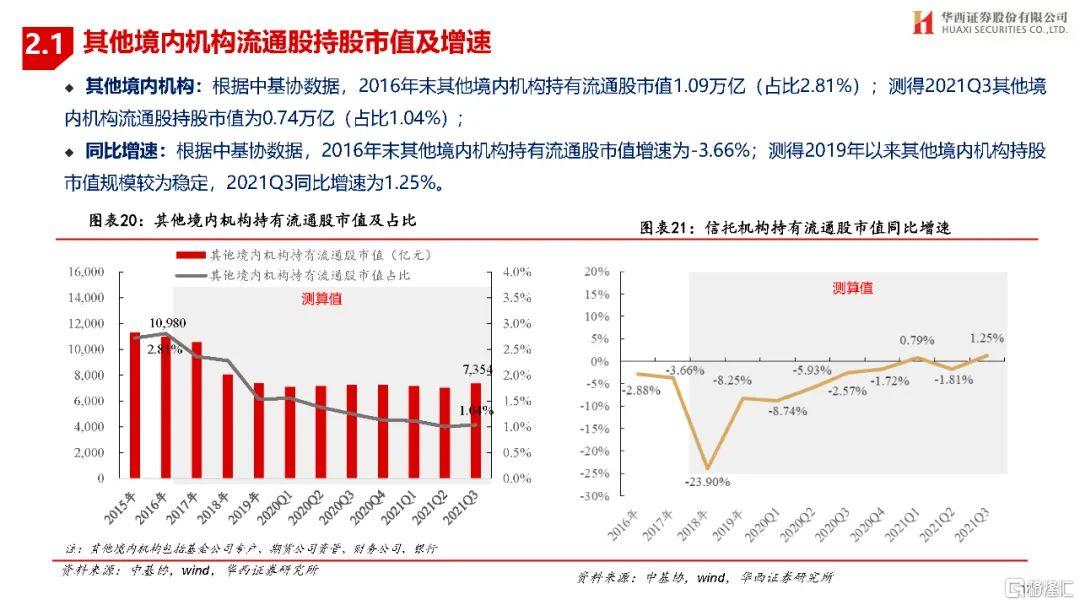
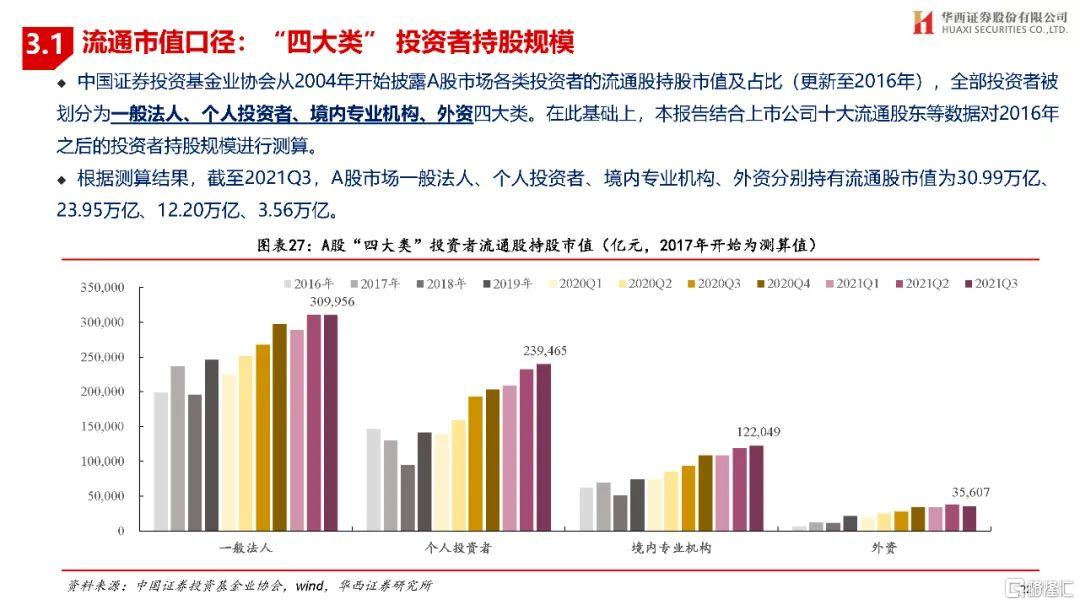
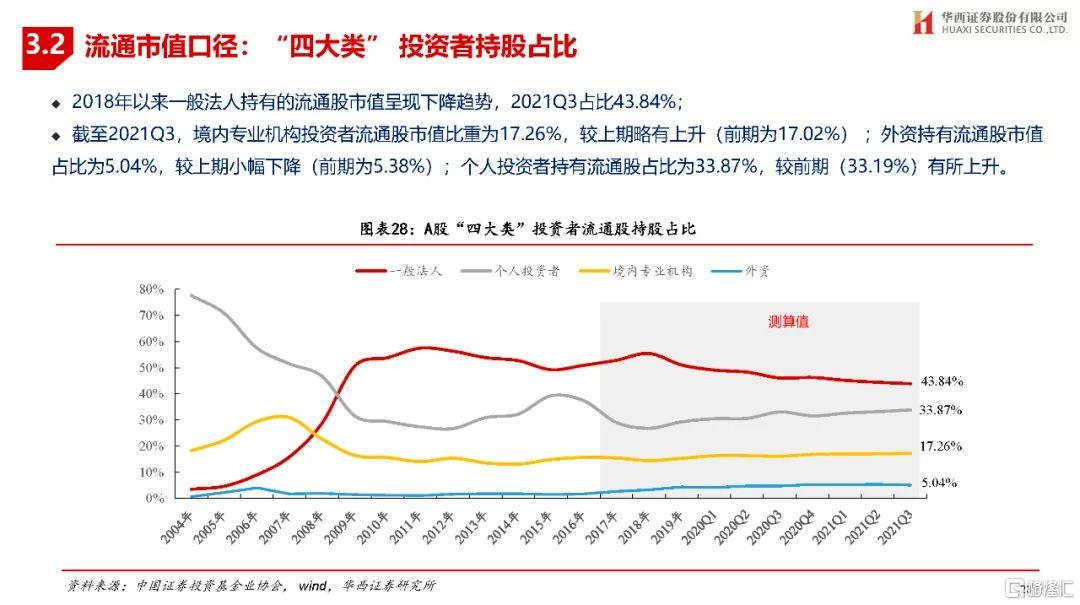
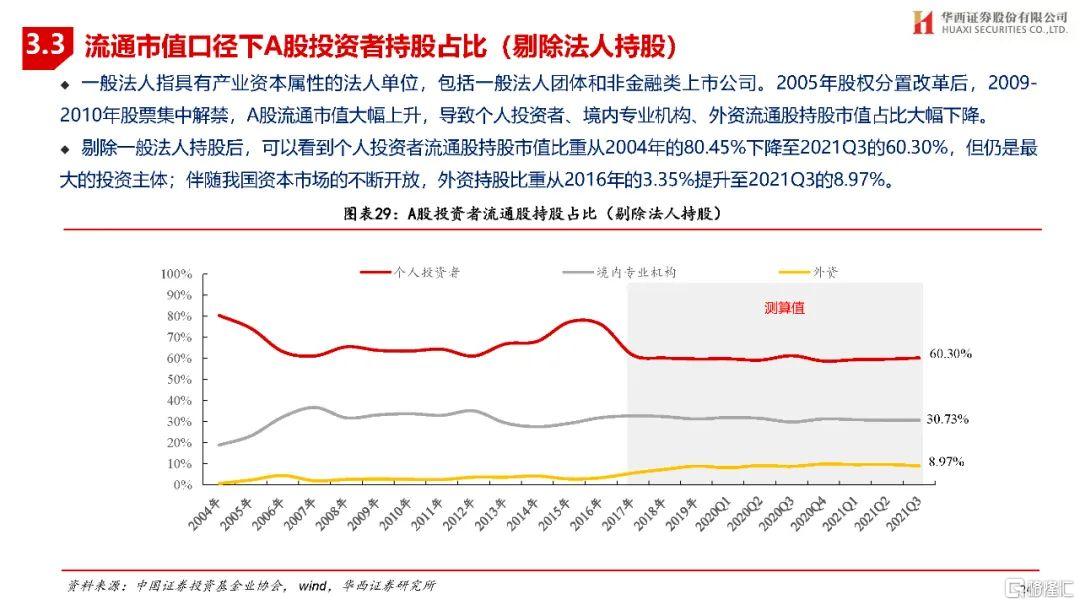
四、其他專業機構(養老金、證券機構、信託機構、其他境內機構)三季度合計持有A股流通市值2.74萬億(前值2.81萬億),佔流通市值比為3.87%(前值4.02%);個人投資者流通股持股佔比依然較高(33.87%)。根據測算,2021年三季度末一般法人流通股持股佔比最高(43.84%),個人投資者次之(33.87%);其他專業機構投資者,養老金流、證券機構、信託機構、其他境內機構流通股持股市值依次為1.16萬億、0.41萬億、0.44萬億、0.74萬億,佔比分別為1.64%、0.57%、0.62%、1.04%
■風險提示:流動性風險,企業盈利不及預期,海外黑天鵝事件(政治風險、主權評級下調等),政策監管(金融去槓桿等),測算誤差,歷史統計規律失效等。
正文


注:文中報吿節選自華西證券研究所已公開發布研究報吿,具體報吿內容及相關風險提示等詳見完整版報吿。
Follow us
Find us on
Facebook,
Twitter ,
Instagram, and
YouTube or frequent updates on all things investing.Have a financial topic you would like to discuss? Head over to the
uSMART Community to share your thoughts and insights about the market! Click the picture below to download and explore uSMART app!

Disclaimers
uSmart Securities Limited (“uSmart”) is based on its internal research and public third party information in preparation of this article. Although uSmart uses its best endeavours to ensure the content of this article is accurate, uSmart does not guarantee the accuracy, timeliness or completeness of the information of this article and is not responsible for any views/opinions/comments in this article. Opinions, forecasts and estimations reflect uSmart’s assessment as of the date of this article and are subject to change. uSmart has no obligation to notify you or anyone of any such changes. You must make independent analysis and judgment on any matters involved in this article. uSmart and any directors, officers, employees or agents of uSmart will not be liable for any loss or damage suffered by any person in reliance on any representation or omission in the content of this article. The content of the article is for reference only and does not constitute any offer, solicitation, recommendation, opinion or guarantee of any securities, virtual assets, financial products or instruments. Regulatory authorities may restrict the trading of virtual asset-related ETFs to only investors who meet specified requirements. Any calculations or images in the article are for illustrative purposes only.
Investment involves risks and the value and income from securities may rise or fall. Past performance is not indicative of future performance. Please carefully consider your personal risk tolerance, and consult independent professional advice if necessary.


