港股午評:科技股普跌,恆生科指大跌1.71%,保利協鑫能源飆漲超62%
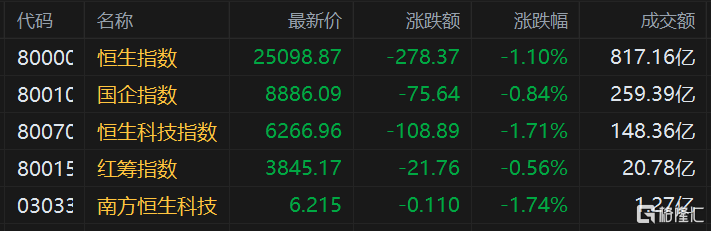
港股上午盤三大指數集體下挫,恆指跌1.1%報25098點,國指跌0.84%報8886點,恆生科技指數跌1.71%報6266點。 南下資金半日淨流入8.75億港元,大市半日成交額為817億港元。
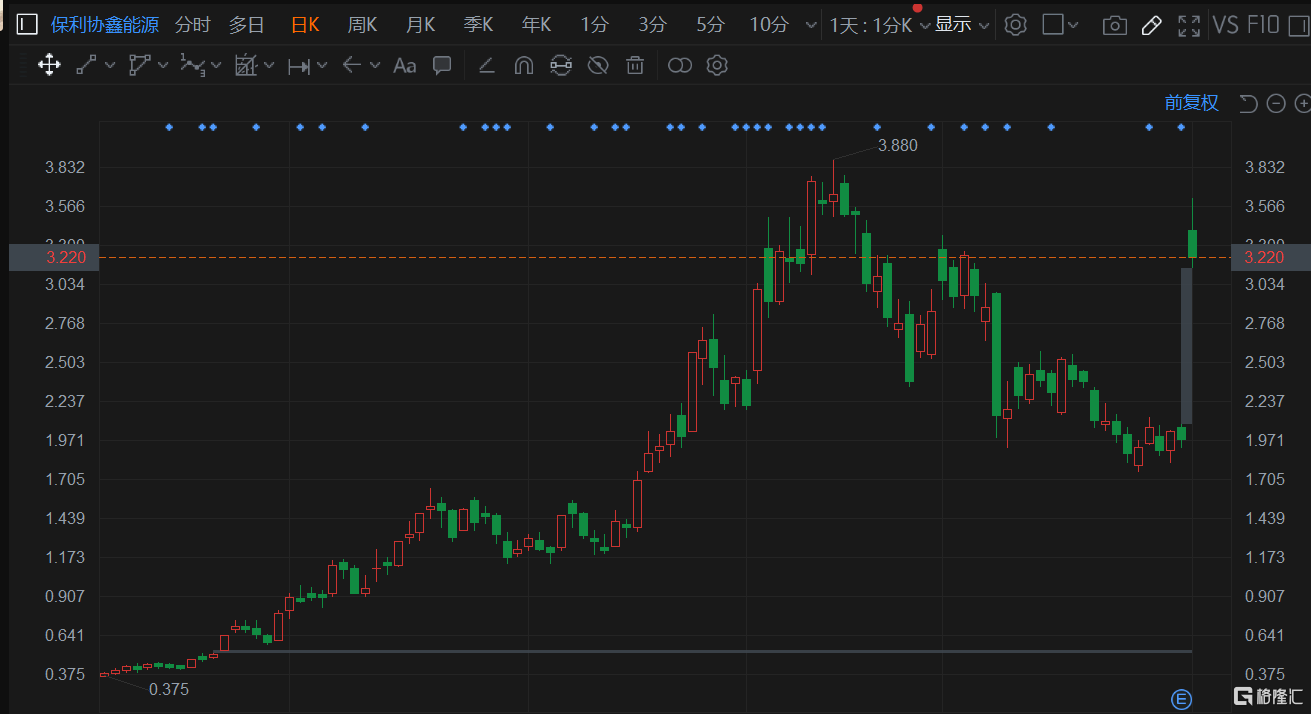
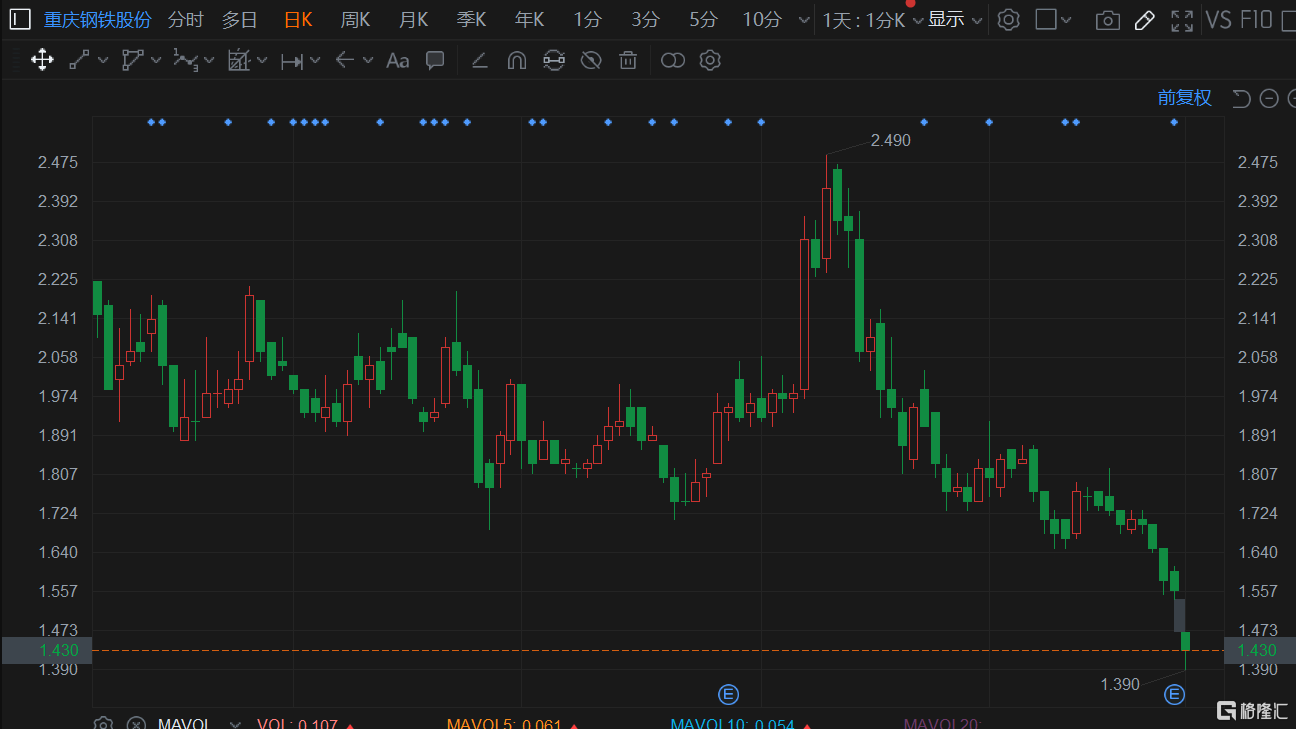
盤面上,大型科技股普跌拖累大市表現低迷,快手、百度跌超3%,阿里巴巴、騰訊、京東跌超2%;醫藥股、汽車股、鋼鐵股、餐飲股、航空股、物管股、內房股、體育用品等熱門股全線走低,海底撈再跌5%連跌8日,重慶鋼鐵績後重挫超8%。 另一方面,煤炭股、內銀股、電力股表現活躍,光伏龍頭保利協鑫能源復牌飆漲超62%。
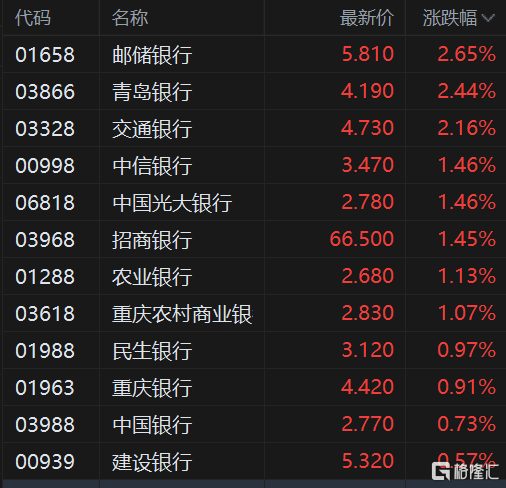
內銀股普漲,前三季逾八成上市銀行業績超疫前水平。六大行前三季度歸母淨利潤均實現兩位數增長,其中,交通銀行增幅最大,同比增長22.1%。以270天計算,六大行前三季平均日賺35.67億元。 另外,超八成上市銀行今年前三季業績已經超過疫情發生前2019年同期水平。經歷疫情“大考”後,優質銀行的業績恢復高歌猛進,而部分銀行仍須努力。 近年來,反映銀行盈利能力的淨息差持續收窄是一大趨勢。但從2021年三季報來看,淨息差略有回升,整體平穩。同時,一些銀行在淨息差收窄的情況下,仍能實現較高增長。
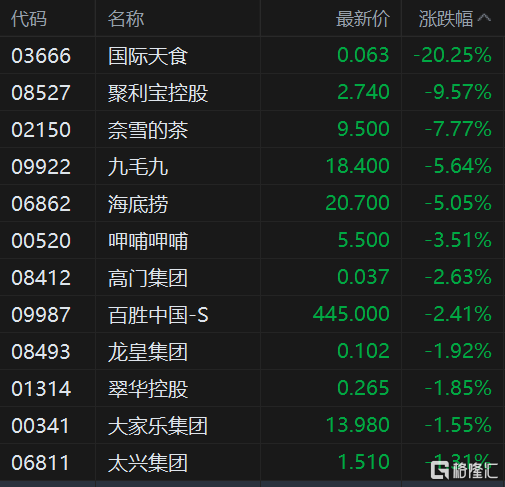
餐飲股延續跌勢,海底撈續跌5%再創調整新低。奈雪的茶預計2021年全年取得收入較2020年的增長幅度將低於預期。 另外,國內新增新冠肺炎確診病例92宗,本土病例佔59宗,包括黑龍江27宗,其中黑河市25宗、甘肅10宗、河北9宗等,餐飲股或受近期疫情拖累。
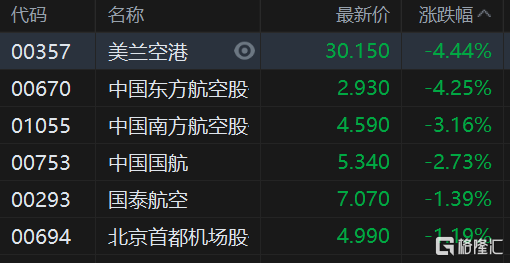
航空股全線走低,四家航企Q3虧損共計逾80億。截至10月29日晚間,南方航空、中國國航、中國東航、春秋航空、吉祥航空陸續公佈業績。2021年第三季度,五家航司營業收入共為707.69億元,歸屬於上市公司股東的淨利潤方面,除春秋航空實現逾一億元淨利潤外,其餘四家虧損共計逾80億元。“三大航”中,中國東航第三季度淨虧損29.54億元,前三季度淨虧損81.62億元;中國國航第三季度虧損35.36億元,前三季度虧損103.22億元;南方航空第三季度淨虧損14.3億元,前三季度淨虧損61.2億元。
保利協鑫能源(3800.HK)飆漲逾62%。公司此前發佈業績顯示上半年淨利潤24.07億元人民幣,同比增長220%。瑞信最新將保利協鑫能源評級上調至跑贏大市,目標價4港元。
重慶鋼鐵股份(1053.HK)跌超8%,三季度淨利同比下降26.63%。公司10月29日公吿稱,今年第三季度營業收入90.94億元,同比增長29.95%;歸屬於上市公司股東的淨利潤1.83億元,同比下降26.63%;歸屬於上市公司股東的扣除非經常性損益的淨利潤1.82億元,同比下降26.05%。
Follow us
Find us on
Facebook,
Twitter ,
Instagram, and
YouTube or frequent updates on all things investing.Have a financial topic you would like to discuss? Head over to the
uSMART Community to share your thoughts and insights about the market! Click the picture below to download and explore uSMART app!

Disclaimers
uSmart Securities Limited (“uSmart”) is based on its internal research and public third party information in preparation of this article. Although uSmart uses its best endeavours to ensure the content of this article is accurate, uSmart does not guarantee the accuracy, timeliness or completeness of the information of this article and is not responsible for any views/opinions/comments in this article. Opinions, forecasts and estimations reflect uSmart’s assessment as of the date of this article and are subject to change. uSmart has no obligation to notify you or anyone of any such changes. You must make independent analysis and judgment on any matters involved in this article. uSmart and any directors, officers, employees or agents of uSmart will not be liable for any loss or damage suffered by any person in reliance on any representation or omission in the content of this article. The content of the article is for reference only and does not constitute any offer, solicitation, recommendation, opinion or guarantee of any securities, virtual assets, financial products or instruments. Regulatory authorities may restrict the trading of virtual asset-related ETFs to only investors who meet specified requirements. Any calculations or images in the article are for illustrative purposes only.
Investment involves risks and the value and income from securities may rise or fall. Past performance is not indicative of future performance. Please carefully consider your personal risk tolerance, and consult independent professional advice if necessary.


