


本文來自格隆匯專欄:證券市場紅週刊,作者:齊永超
截至10月12日收盤,上證、深證指數分別下跌1.25%、1.62%,創業板重挫1.81%,兩市成交金額繼續跌破萬億。而受到“雙控+限電”等多重因素壓制,市場在9月下半場嚴重分化。在兩市成交額出現逐步下降同時,槓桿資金的“態度”也出現了分歧。
接受記者採訪的職業投資人表示,雖然短期難以預期全面牛市出現,但結構性機會仍將突出,其中,“硬科技”仍是中長線值得配置的領域,消費的投資拐點或正在形成。
市場温度較為適中
槓桿資金有一定“回撤”
兩市日成交額在9月上旬創年內新高後,出現逐步“縮水”,與此同時,連續萬億成交格局被打破。據Wind數據顯示,9月中上旬,滬深兩市合計成交金額多為1.3萬億~1.5萬億,其中,9月1日合計成交金額達1.7萬億元,創年內新高。9月下旬以來出現明顯“縮水”,成交金額回落至1萬億~1.3萬億的區間水平。9月30日,節前最一個交易日,兩市成交金額跌破萬億,成交9502億元,重回今年5~6月成交水平,10月11日、1012日,成交金額進一步縮水至9900億元(見附圖)。
附圖 今年以來兩市單日成交金額(億元)
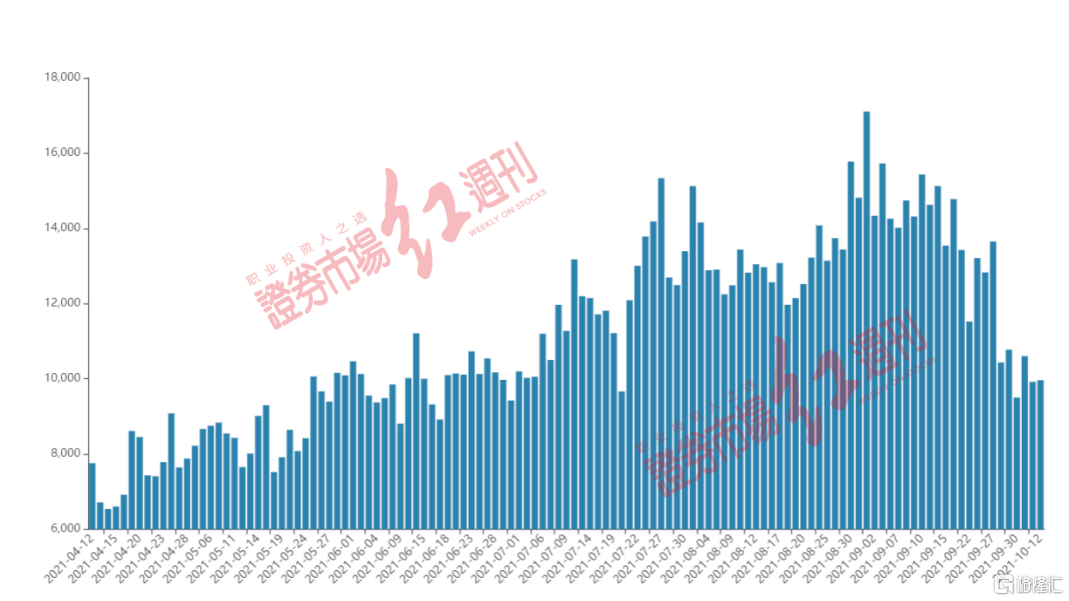
數據來源:Wind
幾乎與兩市成交額縮水保持同步,代表市場人氣的槓桿資金也出現了持續流出現象。一組統計數據顯示,兩市融資餘額自9月15日達到1.75萬億年內高點後持續下滑。截至10月8日數據顯示,兩市融資餘額降至16961億元,縮水622億元。與此同時,槓桿資金單日淨流出過百億的交易日也出現增多,如在9月16日~17日、9月27日、9月29日~30日的5個交易日中,融資淨賣出金額均超過百億。對比來看,年內單日淨賣出超百億的交易日僅為11個,可見,槓桿資金在近期的分歧也不斷加大。
進一步來看,從9月15日以來,28個申萬行業中有25個行業遭到槓桿資金賣出。其中,受到“雙控”影響明顯的有色金屬首當其衝,被賣出金額最高達102億元,電子、非銀金融分別居於賣出榜單第二、第三,被賣出金額均接近80億元。
市場人氣回落,反應了市場對經濟復甦、消費回暖不及預期等方面的擔憂。銀河證券分析認為,受全國性煤炭緊缺、煤電價格倒掛影響,目前已有多省區出現限電的情況,對製造業生產造成較大沖擊,後續還可能會傳導內需走弱,消費疲軟,經濟進一步走低。
但也有機構觀點相對樂觀。悟空投資投研總裁江敬文向記者指出,“整體看A股市場流動性維持在一箇中性偏松的位置,IPO速度相對平穩。宏觀經濟斷崖式下跌的概率不大,經濟增速中樞的回落是平穩的。”
高毅、淡水泉等弱市調研聚焦“硬科技”
機構預期消費行情“拐點”或來臨
雖然面對“雙控+限電”壓制、成交熱度下降、市場走弱等不利因素,但從機構對於上市公司的調研來看,熱度並未因此減弱。據記者梳理顯示,9月份,兩市共有815家上市公司獲機構調研,高於6月-8月(645家、525家與為734家)的水平。
進一步來看,半導體設備、電氣設備等“硬科技”賽道是機構的重點關注領域。如在9月最受機構關注的前10家公司中,“硬科技”公司佔據了絕對份額。如兆易創新、中科創達、滬硅產業-U,受到的調研機構均超過250家,傳音控股、中微公司、匯川技術等也均在200家以上(見表1)。其中,在兆易創新9月初的調研名單中,不乏高毅資產、淡水泉投資、景林資產、混沌投資等知名投資機構,中科創達9月30日的調研名單中同樣出現了高毅資產、淡水泉的身影。此外,9月23日,淡水泉同樣調研了匯川技術(見表2)。
表1 9月以來受機構調研家數居多公司
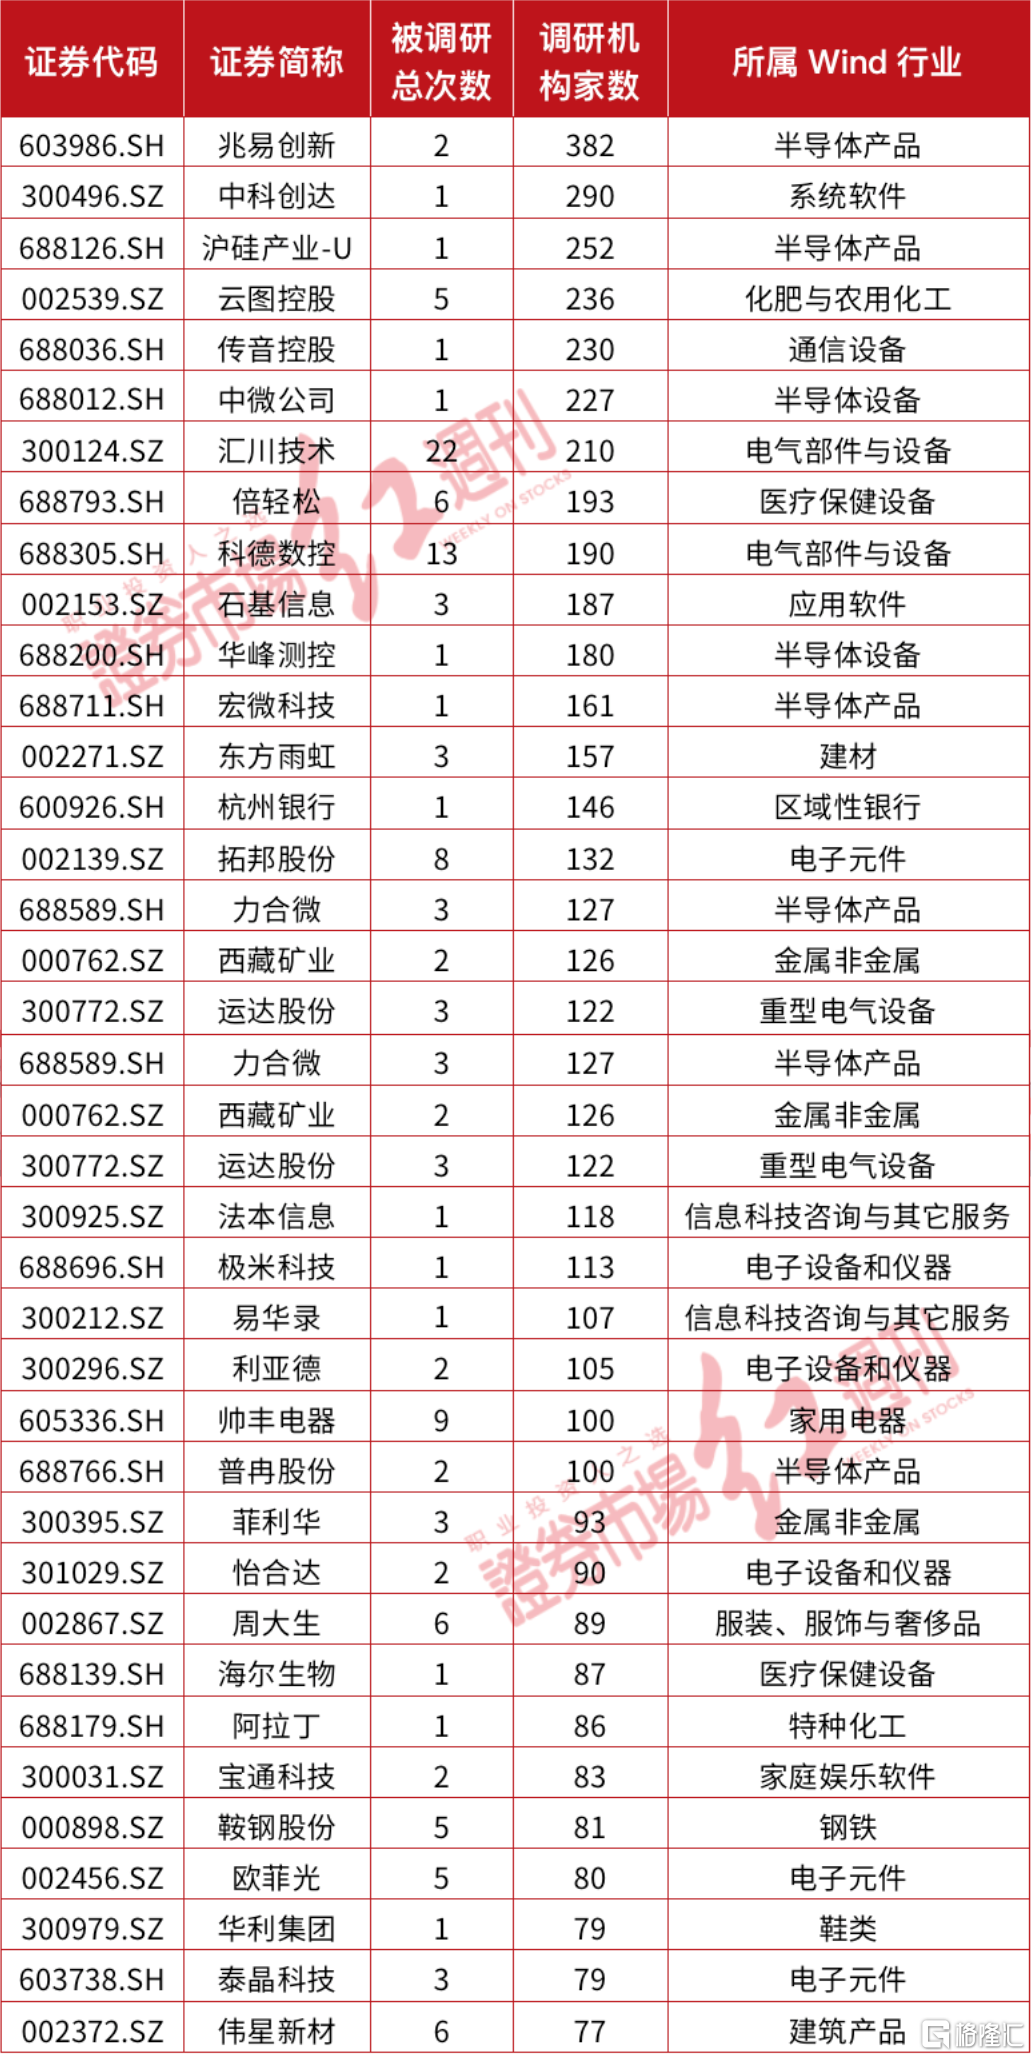
數據來源:Wind
表2 高毅、淡水泉、景林9月調研股(部分)

數據來源:Wind
接受記者採訪的職業投資人表示,“硬科技”、消費等值得重點關注。寶鼎投資董事長張亮向記者指出,“當前,局部的牛市是存在的。在政策和市場需求的雙重驅動下,一些朝陽產業、新興的產業、新興公司仍存在持續走牛的基礎。”
張亮指出,“從目前來看新能源、半導體、儲能、光伏等行業及其相關的產業鏈,未來3-5年伴隨着行業的30%以上的增速,也會迎來自己的一個高速發展期。對技術壁壘高、市場競爭優勢明顯、全產業鏈帶來較高話語權和定價權的頭部企業,這種‘頭部效應’會更加明顯。”
此外,持續調整的消費、醫藥,或正在為一些低風險偏好的投資資金創造一輪新的投資機會。
江敬文也認為,“從歷史回溯看,A股市場一直是追求高景氣的板塊,以及景氣度邊際加速改善的板塊。這符合一個成長型經濟體的特徵。市場的熱點是動態變化的。這個位置的消費醫藥龍頭已經有了一定的配置價值,但我們會更關注景氣的改善。”


More Content


