國債期貨較低的基差意味着什麼?
本文來自格隆匯專欄:國君固收覃漢
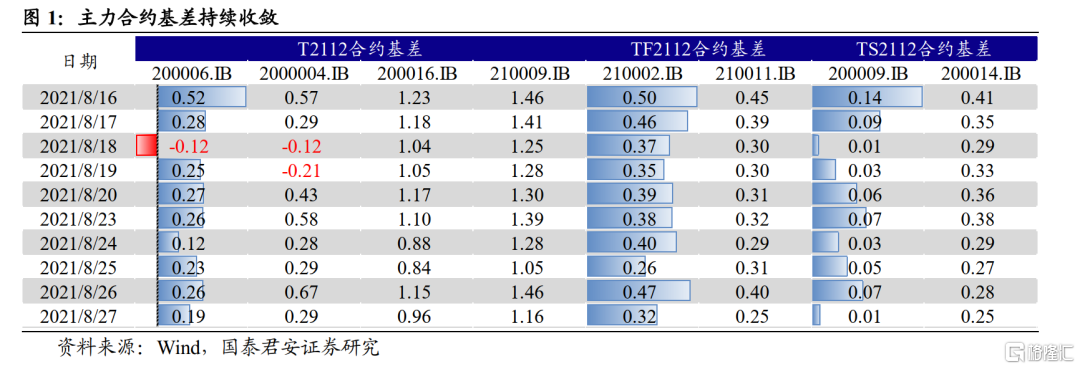
8月中旬,主力合約切換至2112合約後,T2112、TF2112、TS2112對應的基差水平整體持續收斂。截至目前,CTD券20006、210002、200009,對應的基差分別爲0.19、0.32、0.01,分別對應歷史分位數32%、50%、13%,並且低於近三年來同期水平。
根據公式,基差=CDT券淨價-期貨價格*轉換因子。基差收斂,會有兩種成因,要麼現券偏弱,要麼期貨偏強。從盤面來看,國債期貨情緒較強,是最近兩週基差收斂的主因。
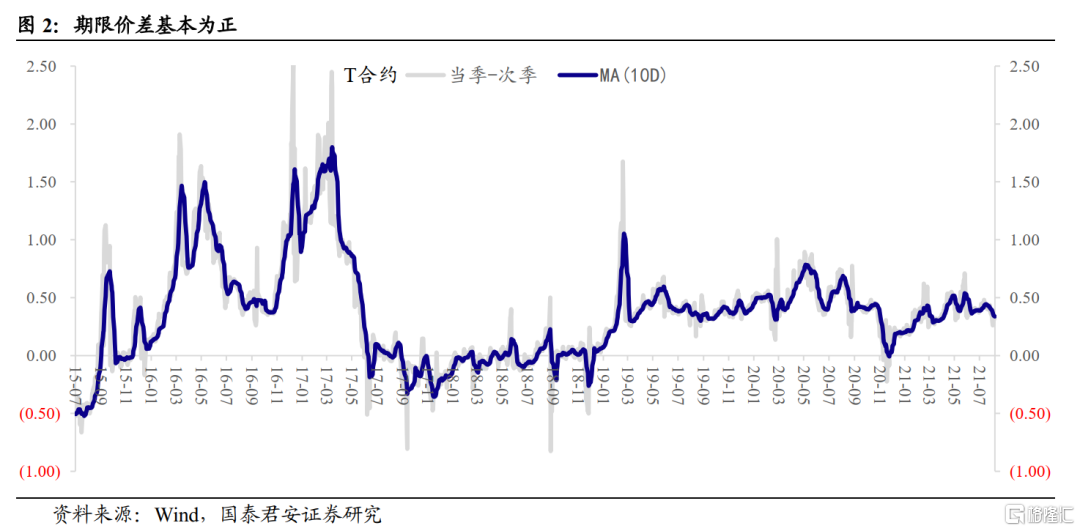
主力合約剛切換,基差就持續收斂,其實有些異常。一般而言,正常的曲線形態意味着短期無風險利率低於長期無風險利率。次季合約與當季合約相比,對於期貨多頭(當季)而言,需要得到期貨的淨價收益來彌補少持有的三個月票息收入;對於期貨空頭(次季)而言,則意味着需要通過回吐期貨淨價損失來回吐多持有的三個月票息收入;否則存在套利機會。因此,次季合約通常貼水幅度更大,跨期價差(=當季合約-次季合約)通常爲正值。
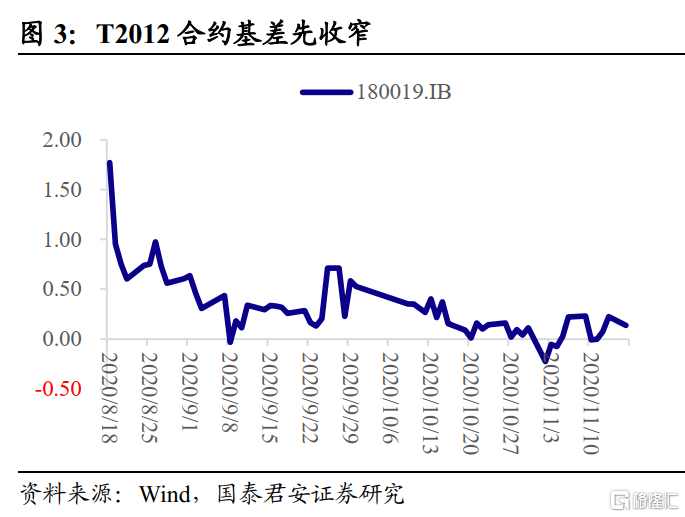
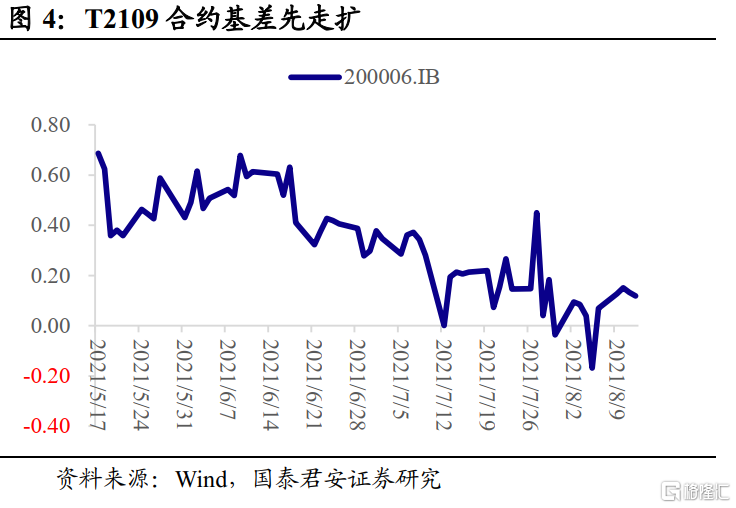
既然通常情況下遠月合約價格更低,所以在主力合約切換後,基差理論上會先上升。隨後,當季合約也慢慢進入交割月,時間價值逐步降低,基差趨於收斂。當然,在大部分情況下,主力合約切換後,基差先收斂還是先走擴,主要取決於現貨和期貨兩個市場的情緒差。放在當前的環境下,基差收斂是期貨情緒較強,而現券情緒偏弱的差異共同導致。
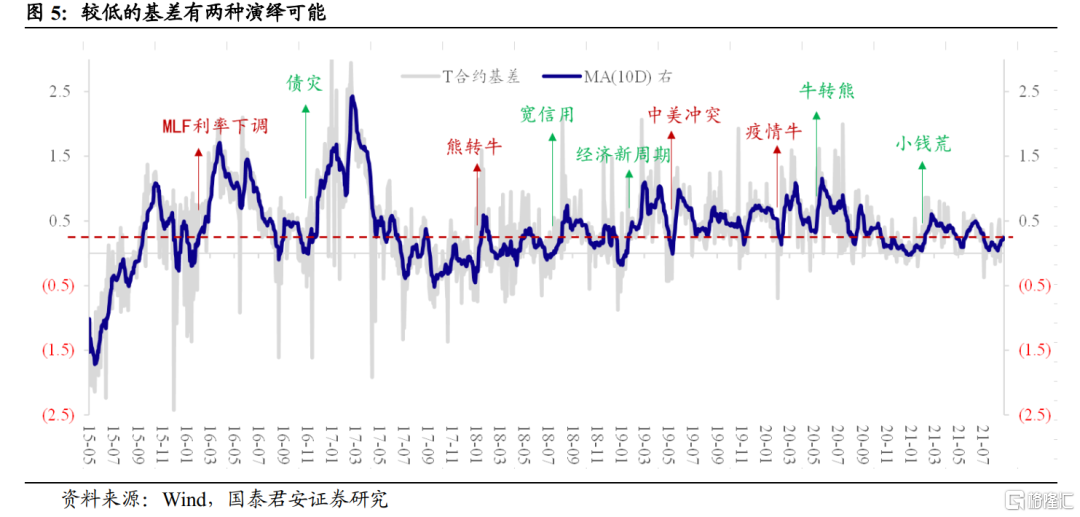
當前較低的基差水平有兩種演繹可能:其一,基差繼續收斂至歷史極低水平。但是歷史上除了2015年和2017年,其餘情況下即便還能向下突破也幾乎都只是暫時的;根據統計套利的規則,基差水平越低,對應的向心力越強。
兩個特殊階段:2015年7月之前,國債期貨的交割申報規則還是“雙方舉手”,而之後從1509合約開始改爲了“賣方舉手”。“賣方舉手”制度下,空頭期權交割價值提高,也因此國債期貨轉爲持續貼水。2017年行情非常極端,是嚴監管大熊市,情緒上非常悲觀。
而基差轉爲走擴,有三種演繹情形:其一,期現同漲,現貨更強,比如近期行情中,現券跟上期貨而補漲;其二,期現同跌,且期貨跌幅更大,相當於近期行情出現反轉;其三,期貨繼續漲而現貨轉跌,但期現不同步的情況較爲少見,很快會趨於同步。
回溯歷史,期現同漲和期現同跌對應的基差走擴行情,從概率上來看,並無明顯差異。比如2020年初啓動的“疫情牛”中,現貨情緒偏強,基差走擴;2020年5月牛轉熊,基差仍舊走擴,但對應的是期貨跌幅更大。
雖然方向並無規律,需要帶有主觀認知來輔助判斷。但比較確定的是,目前這麼低的基差水平不可能長時間維持窄幅震盪;極低的波動率像是被壓縮的彈簧,可能醞釀着新的大行情。(完)
Follow us
Find us on
Facebook,
Twitter ,
Instagram, and
YouTube or frequent updates on all things investing.Have a financial topic you would like to discuss? Head over to the
uSMART Community to share your thoughts and insights about the market! Click the picture below to download and explore uSMART app!

Disclaimers
uSmart Securities Limited (“uSmart”) is based on its internal research and public third party information in preparation of this article. Although uSmart uses its best endeavours to ensure the content of this article is accurate, uSmart does not guarantee the accuracy, timeliness or completeness of the information of this article and is not responsible for any views/opinions/comments in this article. Opinions, forecasts and estimations reflect uSmart’s assessment as of the date of this article and are subject to change. uSmart has no obligation to notify you or anyone of any such changes. You must make independent analysis and judgment on any matters involved in this article. uSmart and any directors, officers, employees or agents of uSmart will not be liable for any loss or damage suffered by any person in reliance on any representation or omission in the content of this article. The content of the article is for reference only and does not constitute any offer, solicitation, recommendation, opinion or guarantee of any securities, virtual assets, financial products or instruments. Regulatory authorities may restrict the trading of virtual asset-related ETFs to only investors who meet specified requirements. Any calculations or images in the article are for illustrative purposes only.
Investment involves risks and the value and income from securities may rise or fall. Past performance is not indicative of future performance. Please carefully consider your personal risk tolerance, and consult independent professional advice if necessary.


