


如何使用線性迴歸通道
格隆匯 06-25 19:46
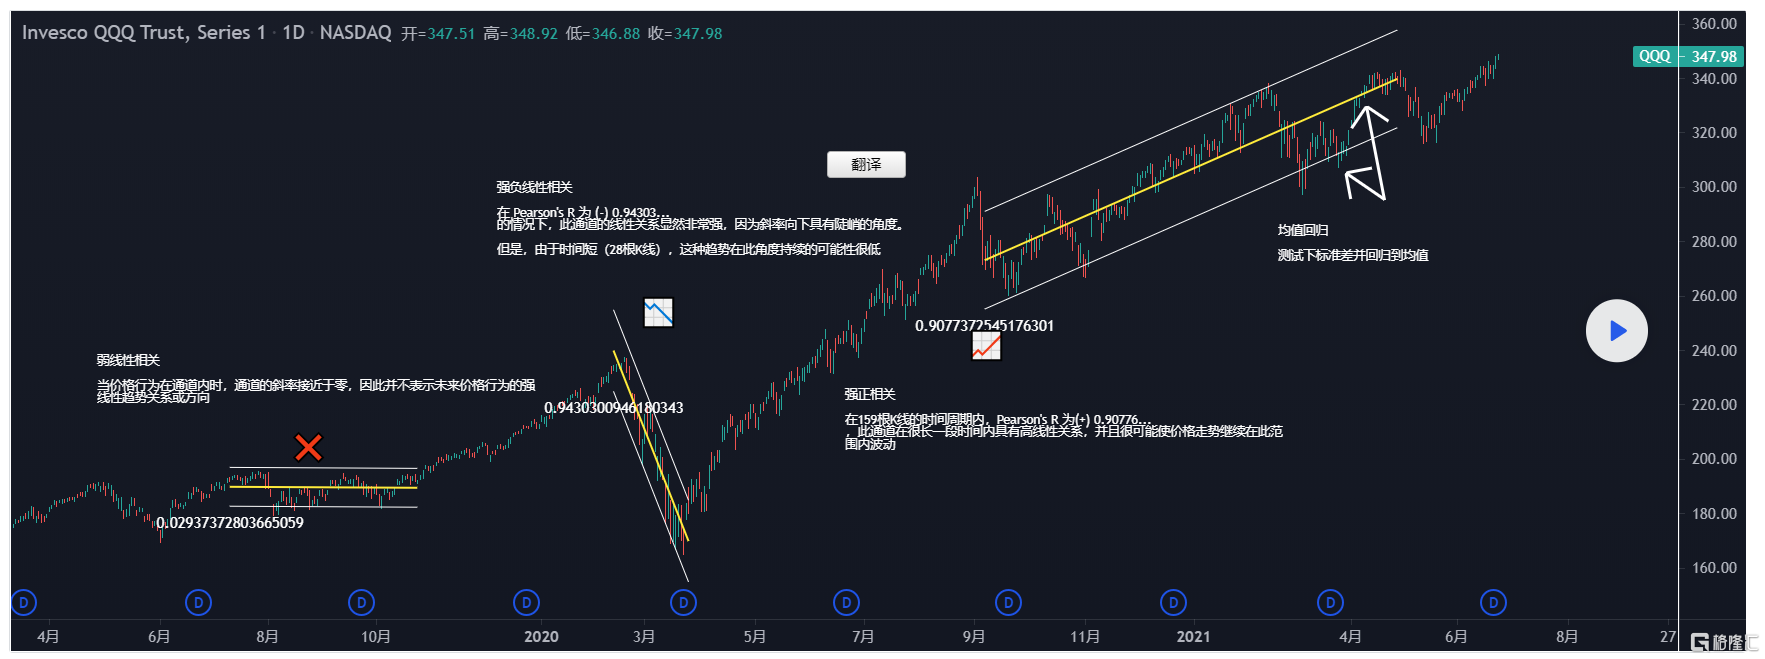
QQQ股票基金圖表由TradingView提供
線性迴歸通道,是通過繪製趨勢的正態分佈來識別未來價格走勢的潛在關鍵水平的好方法。
使用迴歸趨勢工具(位於繪圖面板中的趨勢線工具組)時,會選擇趨勢上的兩個點,通常在趨勢的起點和終點。
選擇圖表上的兩個點時,將在兩個選定的點之間計算數據集的正態分佈,並以線性迴歸通道的形式顯示。
此通道的中心線是線性迴歸線或均值,上、下線是在工具設置中設定的均值的上下標準差(默認設置為均值的+2和-2標準差)。
線性關係的相關性顯示為Pearson’s相關係數或Pearson’s R。可以在工具樣式菜單中選擇它,在圖表上顯示或隱藏。
Pearson’s R顯示了相關的強度及其方向,它的值在-1和1之間移動。隨着Pearson’s R越來越遠離零,價格和時間之間線性關係隨之增強。使用迴歸趨勢工具時,Pearson’s R將始終設置為絕對值(正),但是可以直觀地識別趨勢的方向。
均值迴歸
當迴歸趨勢具有高相關性時,這是由於沿着平均價格(中心線)的價格行為的一致性,只有較少的點在平均線上下移動到上下標準差水平。
使用線性迴歸通道進行交易的一種方法是在價格行為遠離和回到均值時進行交易。
使用此工具時,請重點注意,與僅包含少量K線且具有高相關性的通道相比,包含更多K線且具有高相關性的通道,更有可能使價格繼續保持該趨勢。當交易使用這些通道時,應考慮趨勢的長度。
使用迴歸趨勢工具,您只需點擊幾個按鈕,即可開始在交易策略中利用統計分析!
本文來源:TradingView
作者:TradingView
Follow us
Find us on Facebook, Twitter , Instagram, and YouTube or frequent updates on all things investing.Have a financial topic you would like to discuss? Head over to the uSMART Community to share your thoughts and insights about the market! Click the picture below to download and explore uSMART app!

Disclaimers
uSmart Securities Limited (“uSmart”) is based on its internal research and public third party information in preparation of this article. Although uSmart uses its best endeavours to ensure the content of this article is accurate, uSmart does not guarantee the accuracy, timeliness or completeness of the information of this article and is not responsible for any views/opinions/comments in this article. Opinions, forecasts and estimations reflect uSmart’s assessment as of the date of this article and are subject to change. uSmart has no obligation to notify you or anyone of any such changes. You must make independent analysis and judgment on any matters involved in this article. uSmart and any directors, officers, employees or agents of uSmart will not be liable for any loss or damage suffered by any person in reliance on any representation or omission in the content of this article. The content of the article is for reference only and does not constitute any offer, solicitation, recommendation, opinion or guarantee of any securities, virtual assets, financial products or instruments. Regulatory authorities may restrict the trading of virtual asset-related ETFs to only investors who meet specified requirements. Any calculations or images in the article are for illustrative purposes only.
Investment involves risks and the value and income from securities may rise or fall. Past performance is not indicative of future performance. Please carefully consider your personal risk tolerance, and consult independent professional advice if necessary.

More Content

CS Hotline: +852 3018 4526
Trading days: 24 hours | Non-trading days: 9:00-18:00


