石油價格戰一週年,油氣板塊絕地反擊?
去年此時,油氣板塊史無前例大跌。
今年此時,油氣板塊領漲大盤。
去年最慘板塊:油氣
2020年3月8日,俄羅斯和沙特阿拉伯爆發石油價格戰,2020年3月9日,國際原油市場油價大跌30%,引發了2020年3月9日的全球股市暴跌。價格戰期間,全球二級市場的油氣板塊"慘遭血洗",股價腰斬不計其數,破產油企亦不鮮見,美油期貨抄底者更是抄到了史無前例的負油價!
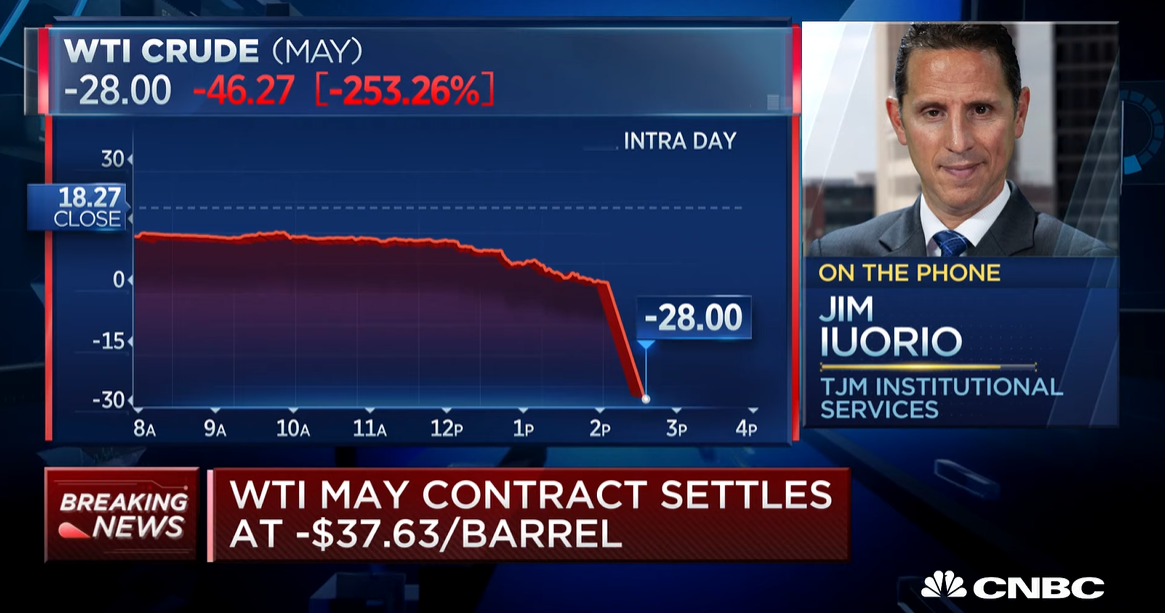 圖片:2020年4月20日,5月美國WTI原油期貨大跌305.97%,
報收-37.63美元,史無前例的負油價
今年最強板塊:油氣
2021年的開局,科技股仍在狂飆,發出最強音,然而隨着美國十年期國債收益率在2月25日一舉狂飆突破1.5的警戒線,觸及1.61,科技股開始連連重挫,納斯達克綜合指數一度累跌10%,"港版納指"恆生科技指數累計跌超11%。
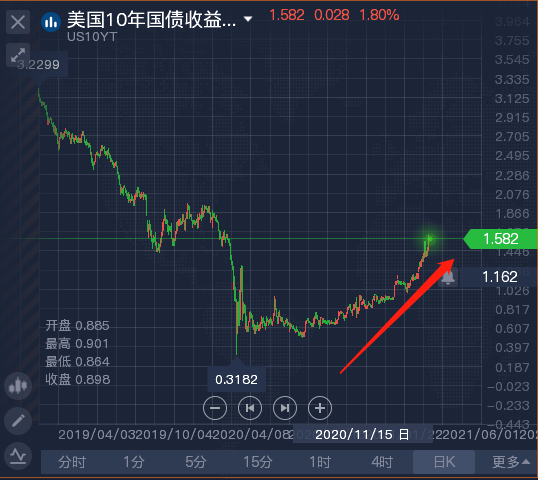
隨着疫苗的接種,疫情不斷改善,全球經濟復甦的預期不斷提升,美國十年期國債收益率開始飆升,打壓科技股、黃金股,油氣、金融則逆市成爲抗跌的順週期板塊。
經濟復甦預期的順週期板塊爲:油氣、金融、娛樂。去年最傷投資者的油氣、金融板塊,今年反而表現最佳。
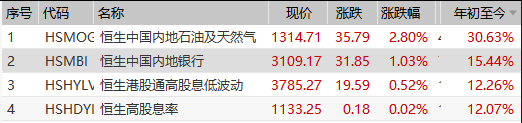
圖片來源:wind
wind數據顯示,28個恆生主題指數中,年初至今(截至3月8日11:11分),恆生中國內地石油及天然氣漲勢最強(累計漲幅31.58%),恆生中國內地銀行位居漲幅榜第二(累計漲幅15.68%),恆生醫療保健表現最差墊底(累計表現-4.99%),恆生港股通新經濟表現倒數第二(累計表現-3.43%)。
恆生中國內地石油及天然氣的成分股(中國石油股份、中國海洋石油、中海油田服務、中國石油化工股份、中石化煉化工程),年初至今漲幅從29%-33%不等。
恆生中國內地銀行的成分股,年初至今漲幅從8%-43%不等,其中獲得"中國巴菲特"李錄重倉加持的郵儲銀行(1658)累計漲幅43.15%,位居榜首,招商銀行累計漲幅高達21.53%,位居第二。
油氣板塊此輪上漲的邏輯在於:需求端方面,經濟復甦的大背景,需求空間大;供給端方面,OPEC+繼續維持大規模減產,疊加近期中東不穩定地緣政治因素等。
風險提示:宏觀經濟波動,外部需求波動。
Follow us
Find us on
Facebook,
Twitter ,
Instagram, and
YouTube or frequent updates on all things investing.Have a financial topic you would like to discuss? Head over to the
uSMART Community to share your thoughts and insights about the market! Click the picture below to download and explore uSMART app!

Disclaimers
uSmart Securities Limited (“uSmart”) is based on its internal research and public third party information in preparation of this article. Although uSmart uses its best endeavours to ensure the content of this article is accurate, uSmart does not guarantee the accuracy, timeliness or completeness of the information of this article and is not responsible for any views/opinions/comments in this article. Opinions, forecasts and estimations reflect uSmart’s assessment as of the date of this article and are subject to change. uSmart has no obligation to notify you or anyone of any such changes. You must make independent analysis and judgment on any matters involved in this article. uSmart and any directors, officers, employees or agents of uSmart will not be liable for any loss or damage suffered by any person in reliance on any representation or omission in the content of this article. The content of the article is for reference only and does not constitute any offer, solicitation, recommendation, opinion or guarantee of any securities, virtual assets, financial products or instruments. Regulatory authorities may restrict the trading of virtual asset-related ETFs to only investors who meet specified requirements. Any calculations or images in the article are for illustrative purposes only.
Investment involves risks and the value and income from securities may rise or fall. Past performance is not indicative of future performance. Please carefully consider your personal risk tolerance, and consult independent professional advice if necessary.


