需求增長+產品漲價+國產替代,士蘭微(600460.SH)能否極地反擊?
截至2021年2月4日,士蘭微漲停收盤,或許市場看好士蘭微產品需求增長+產品漲價+國產替代的邏輯。
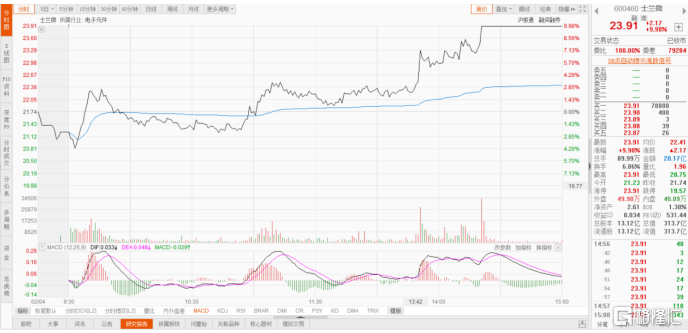
數據來源:東方財富
一.背景
在晶圓廠持續滿產能,訂單延後的情況下,隨着5G電池、智能手機、工業、電動汽車及IOT設備需求拉動下,供給與需求的失衡,導致了功率半導體的漲價。
士蘭微作為國產半導體領先企業,採用國際上多數半導體領導企業的IDM模式,目前公司已經擁有了8英寸和12英寸的產線,把產能的命運緊緊掌握在自己手中。
二.市場或許看好士蘭微產品需求增長+漲價+國產替代的邏輯
市場為何給予士蘭微今天漲停,或許市場看好士蘭微經營的產品需求增長+漲價+國產替代的邏輯。產品漲價的邏輯上面已經講了,下面講產品需求增長和國產替代的邏輯。
三.國產半導體IDM龍頭
(1)公司經營產品比較廣泛
2020H1財報顯示分立器件佔營收54%,達9.21億元,今天主要來講功率半導體。
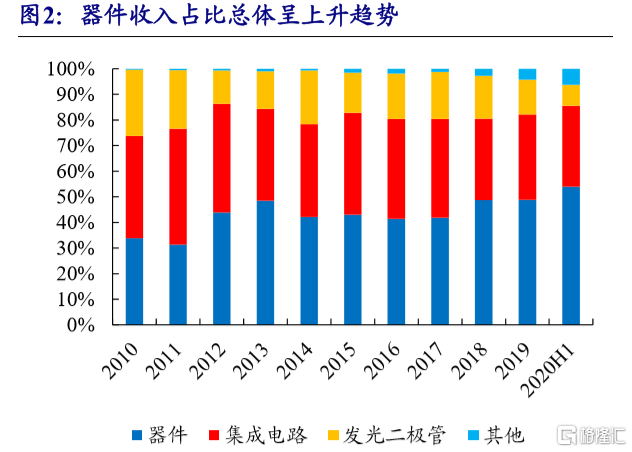
數據來源:開源證券
(2)功率半導體簡介
用電的地方就有功率半導體,其應用範圍極廣,據IHS數據,2019年全球功率半導體市場規模達到403億美元;目前市場上應用最廣的是MOSFET和IGBT。
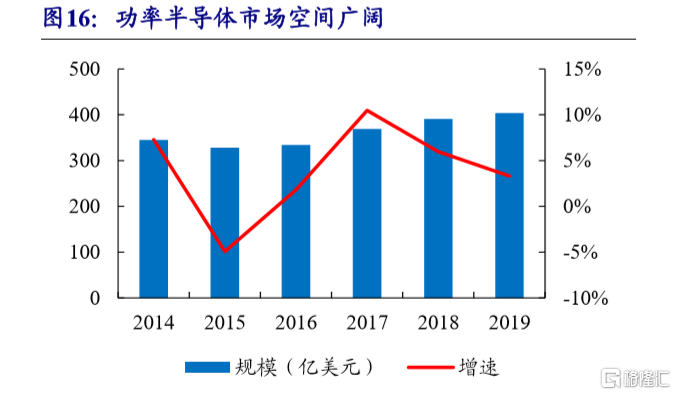
數據來源:開源證券
(3)2021年MOSFET第一張漲價通知已經發布
MOSFET主要應用於消費電子的主板跟電路板以及電動車等領域。
隨着新能源汽車動力系統、充電樁和5G、人工智能帶來龐大的數據量,MOSFET將迎來新需求。並且近期多數廠商發佈MOSFET漲價也反映了這個預期。
(4)新能源汽車將為IGBT模塊需求帶來強勁動力
隨着新能源汽車迎來高速增長期,2020年11月新能源汽車產銷分別為19.8萬輛和20萬輛,同比分別增長75.1%和104.9%,預計2025年全球新能源汽車有望達到1100萬輛,中國佔50%。
預計汽車用IGBT模塊2018年-2023年複合年增長率達23.5%。
三.功率半導體競爭格局
目前全球前十大功率半導體廠商皆為海外廠商,佔據全球功率半導體60%的市場份額。
英飛凌、安森美和瑞薩佔據MOSFET市場近50%;英飛凌、三菱電機、富士電機佔據IGBT 61%的市場份額。
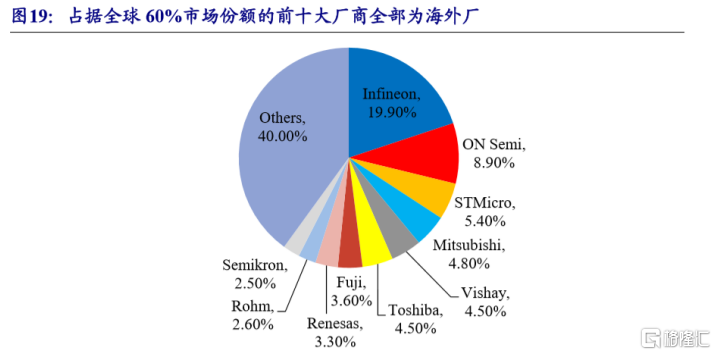
數據來源:開源證券
四.功率半導體國產替代空間巨大
目前我國功率半導體需求佔全球市場需求的36%,國產替代空間巨大。
受地緣政治影響,中美貿易戰、“中興時間”、“華為制裁”,中國越來越重視半導體產業鏈的建設,國內廠商為了供應的穩定性,也越來越注重培養國內供應商。
五.大基金入股為公司提供強大後盾
公司IDM模式,前期投入巨大,大基金入股可以解決公司資金問題;近期大基金通過公司的定增入股,解決了公司8英寸產線建設問題。
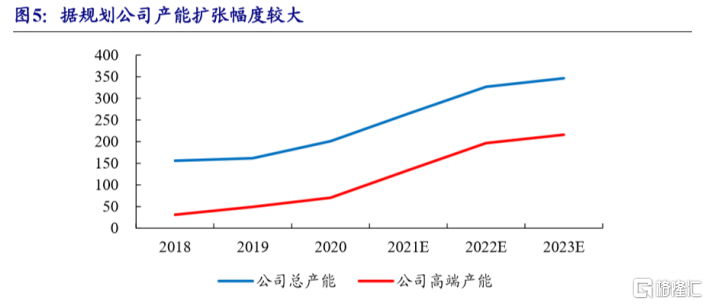
公司早年依賴自身5/6英寸產線生產,生產產品相對低端,近年來開始建設8英寸、12英寸產線,隨着高端產能爬坡完成,高附加值產品營收佔比將持續提高。
數據來源:開源證券
六.小結
大基金入股一方面是看好公司經營前景,另一方面也解決了公司IDM經營模式資金需求量大的問題;隨着公司高端產能的不斷釋放,產品需求+產品漲價+國產替代的邏輯,可讓公司實現極地反擊。
Follow us
Find us on
Facebook,
Twitter ,
Instagram, and
YouTube or frequent updates on all things investing.Have a financial topic you would like to discuss? Head over to the
uSMART Community to share your thoughts and insights about the market! Click the picture below to download and explore uSMART app!

Disclaimers
uSmart Securities Limited (“uSmart”) is based on its internal research and public third party information in preparation of this article. Although uSmart uses its best endeavours to ensure the content of this article is accurate, uSmart does not guarantee the accuracy, timeliness or completeness of the information of this article and is not responsible for any views/opinions/comments in this article. Opinions, forecasts and estimations reflect uSmart’s assessment as of the date of this article and are subject to change. uSmart has no obligation to notify you or anyone of any such changes. You must make independent analysis and judgment on any matters involved in this article. uSmart and any directors, officers, employees or agents of uSmart will not be liable for any loss or damage suffered by any person in reliance on any representation or omission in the content of this article. The content of the article is for reference only and does not constitute any offer, solicitation, recommendation, opinion or guarantee of any securities, virtual assets, financial products or instruments. Regulatory authorities may restrict the trading of virtual asset-related ETFs to only investors who meet specified requirements. Any calculations or images in the article are for illustrative purposes only.
Investment involves risks and the value and income from securities may rise or fall. Past performance is not indicative of future performance. Please carefully consider your personal risk tolerance, and consult independent professional advice if necessary.


