外資最新“團寵”名單曝光,格力電器位居榜首,其後還有誰?
作者:王飛
來源:證券市場紅週刊
繼境外投資者持股比例披露指標被完善以來,外資的“團寵”名單更換頻繁,最新的數據顯示,共有格力電器、華測檢測、美的集團、廣聯達和啟明星辰五家公司上榜。不過,《紅週刊》記者注意到,外資的“團寵”名單比較固定,僅有八家上市公司相互替換,並無其他公司“插足”。但除此之外,據記者梳理,正有六家公司的外資持股比例快速上升。
那麼,這些外資“團寵”有怎樣的魅力呢?
格力電器的外資持股比例最高
反超美的集團
10月30日,深交所發佈新修訂的《深圳證券交易所合格境外機構投資者和人民幣合格境外機構投資者證券交易實施細則》(以下簡稱《實施細則》),自11月1日起施行。深交所在新聞稿中指出,“隨着A股近年來納入MSCI、富時羅素等國際重要指數,境外投資者投資A股的熱情和信心不斷增強,為便於相關機構儘早瞭解外資持股情況,有更充分的時間作出反應,將外資持股比例披露指標由26%調整至24%;優化外資合計持股超過30%時的減持安排等。”而這直接導致外資的“團寵”名單大擴容。
據記者統計,在新細則實施之前(按照26%的持股比例披露),10月份上榜外資“團寵”名單僅有美的集團和啟明星辰兩家公司,其中美的集團一直是外資的“座上賓”,外資的持股比例常年在26%以上。但在新細則實施的10月30日(按照24%的持股比例披露),華測檢測、格力電器、廣聯達、索菲亞和泰格醫藥分別以25.95%、25.71%、25.66%、24.79%和24.40%的持股比例出現在了外資的“團寵”名單。至11月6日,進入外資的“團寵”名單的公司數量創下了歷史記錄達到八家,其中新進入的是大族激光(24.07%)。
或是由於這八家公司曝光度的提升,外資“開始”擴圍。據記者梳理,近期外資的“團寵”名單更換頻繁。其中,至11月11日收盤,格力電器的外資持股比例達到了26.54%,反超了外資的“座上賓”美的集團。
當然,除了這八家公司之外,也有多家公司的外資持股比例正在逼近24%的披露指標。如寧波銀行,其目前所有外資的持股數量(QFII是三季度末的數據)佔其總股本的比例為21.87%(見表1)。
表1 外資持股比例居前的公司一覽(除上述八家外)
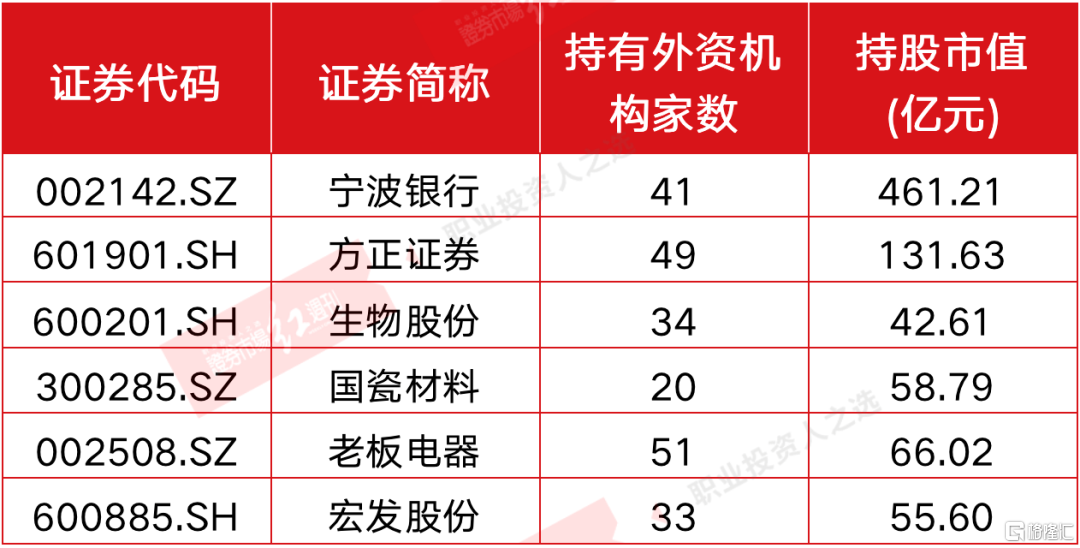
數據來源:Wind
外資“團寵”的公司
淨資產收益率均超10%
這些“團寵”公司是靠什麼吸引外資的呢?
據瞭解,上市時間較長或是其魅力之一。公開資料顯示,這八家公司中“年紀最大”的是格力電器,其於1996年上市;“年紀最小”的是美的集團,其於2013年上市。但實際上,美的集團的前身美的電器是於1993年上市。
一般而言,上市時間越長的公司,其可參考的財務數據更有價值。對此,有投資人向記者表示,正常情況下,上市未滿三年的公司不會進入其股票池。即使參與打新,其也會在中籤後的首個開板日賣出。
而據記者統計,這八家公司的業績相對穩定,並且長期來看盈利能力普遍較強。統計數據顯示,在這八家公司中,有六家去年的扣非淨利潤相比9年前同比增長在500%及其以上,其中泰格醫藥同比增速最快為1752.52%。而“股王”貴州茅台去年的扣非淨利潤相比9年前同比增長才為719.90%。
同樣的,在其他財務指標上如淨資產收益率(ROE),這八家公司也優勢明顯。統計數據顯示,今年三季度末,在這八家公司中,有六家的 ROE在10%及其以上,其中美的集團最高為20.53%(見表2)。
表2 外資“團寵”的公司基本面情況一覽
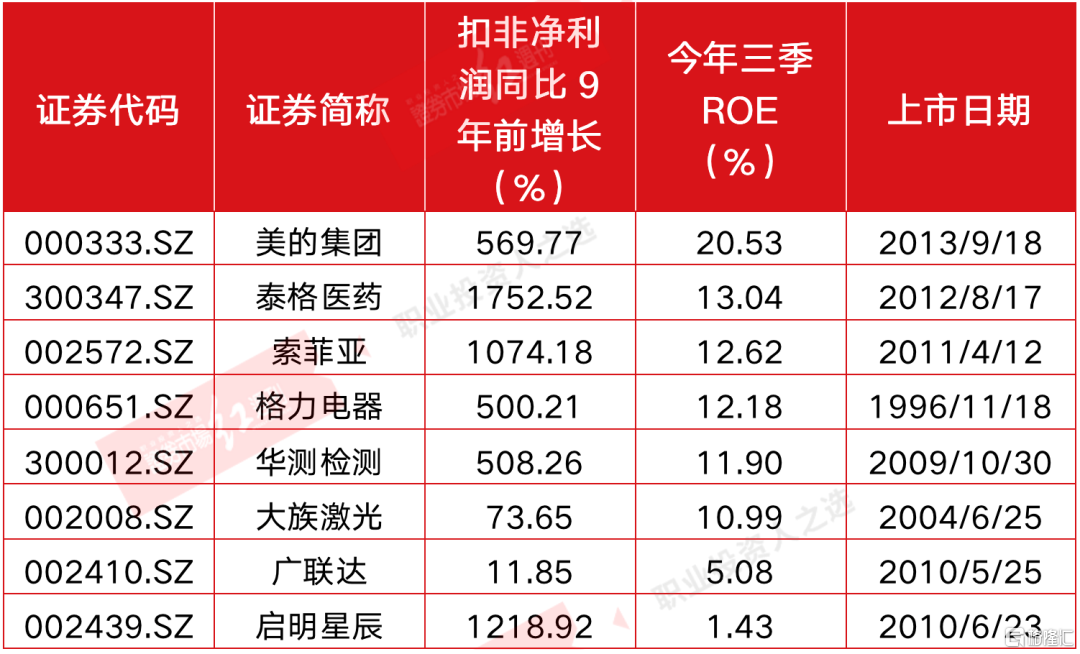
數據來源:Wind
(文中提及個股僅做舉例分析,不做投資建議。)
Follow us
Find us on
Facebook,
Twitter ,
Instagram, and
YouTube or frequent updates on all things investing.Have a financial topic you would like to discuss? Head over to the
uSMART Community to share your thoughts and insights about the market! Click the picture below to download and explore uSMART app!

Disclaimers
uSmart Securities Limited (“uSmart”) is based on its internal research and public third party information in preparation of this article. Although uSmart uses its best endeavours to ensure the content of this article is accurate, uSmart does not guarantee the accuracy, timeliness or completeness of the information of this article and is not responsible for any views/opinions/comments in this article. Opinions, forecasts and estimations reflect uSmart’s assessment as of the date of this article and are subject to change. uSmart has no obligation to notify you or anyone of any such changes. You must make independent analysis and judgment on any matters involved in this article. uSmart and any directors, officers, employees or agents of uSmart will not be liable for any loss or damage suffered by any person in reliance on any representation or omission in the content of this article. The content of the article is for reference only and does not constitute any offer, solicitation, recommendation, opinion or guarantee of any securities, virtual assets, financial products or instruments. Regulatory authorities may restrict the trading of virtual asset-related ETFs to only investors who meet specified requirements. Any calculations or images in the article are for illustrative purposes only.
Investment involves risks and the value and income from securities may rise or fall. Past performance is not indicative of future performance. Please carefully consider your personal risk tolerance, and consult independent professional advice if necessary.


