A股高位放量3連跌,茅台重挫近8%創一年多最大單日跌幅
來源:wind
7月16日,滬深兩市放量大跌,主要股指跌幅均超過4%,中芯國際科創板上市首日,滬港兩地走勢迥異,A股漲逾200%,港股卻大跌近25%。
7月16日,滬深兩市大幅下跌,截至收盤,上證指數跌4.50%報收於3210.10點;深證成指跌5.37%報收於12996.34點;創業板指跌5.93%報收於2646.26點,萬得全A總成交1.45萬億元。
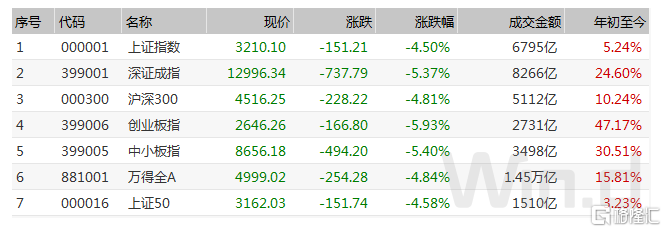
(圖片來源:Wind金融終端“滬深綜合屏”)
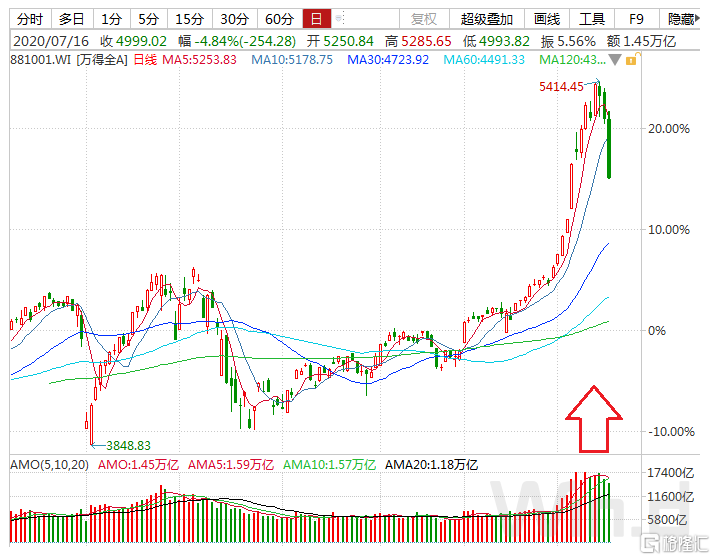
成交量連續11天過萬億
7月16日,A股放量下跌,萬得全A總成交額達1.45萬億元,連續11天突破萬億。相比之前萬億成交持續上漲不同,近日市場持續回調,並已連續三日下跌,今日跌幅進一步擴大,主要股指跌幅均超過4%。
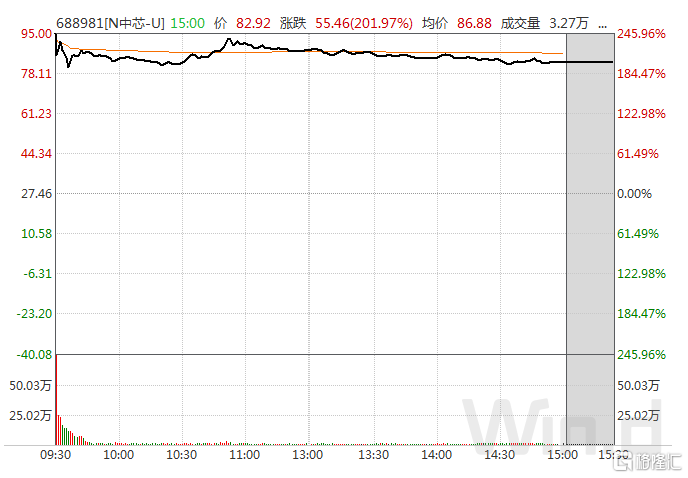
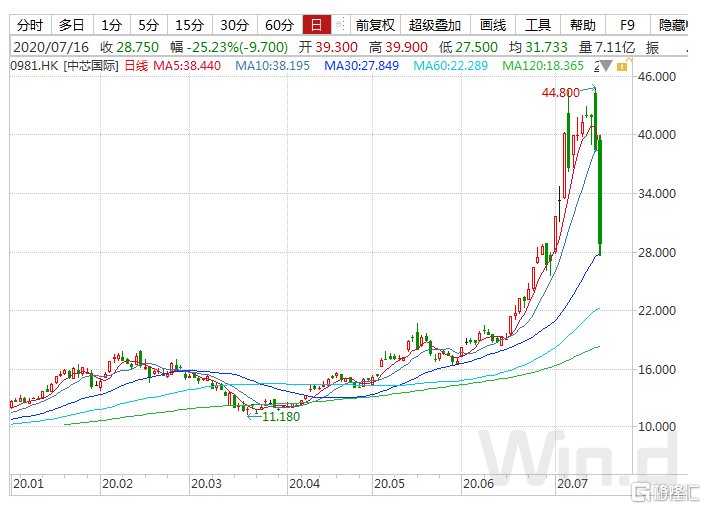
中芯國際科創板上市首日滬港兩地走勢分化
7月16日,中芯國際在科創板掛牌上市,雖然科創板股價收盤漲幅超200%,但港股當日跌幅卻超25%,相比港股28.75港元的股價,AH股溢價率超過200%。
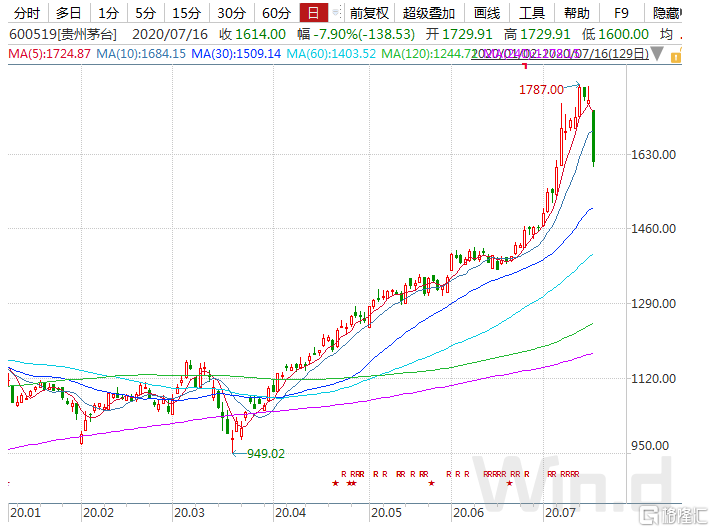
茅台創一年多來最大單日跌幅
7月16日,貴州茅台低開低走,最終收跌7.90%,報收1614.00元,全天成交額為169億元。
貴州茅台上一次的跌幅超過7.9%是在2018年10月29日,當天茅台一字板跌停,其原因是因為業績不及預期所致,貴州茅台2018年第三季度歸母淨利潤89.69億元,同比增長2.7%,為2015年第四季度來最低增速。
北上資金單日流出逾170億
7月16日,北上資金淨流出69.20億元,連續3日淨流出,本週淨流出201.59億元,本月淨流入收窄至383.57億元。

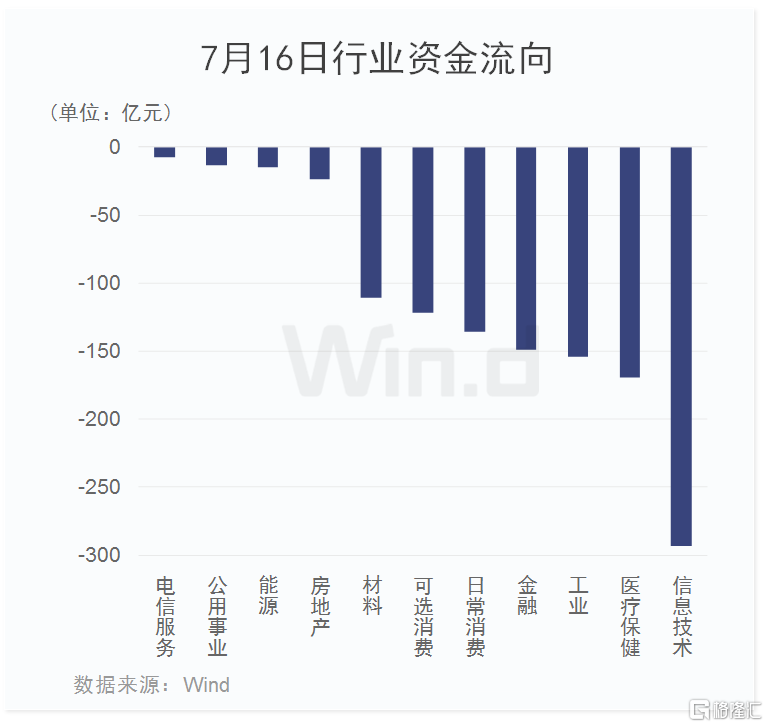
信息技術板塊資金出逃近300億
從7月16日行業資金流向來看,主力資金淨流出1100多億元,所有板塊均淨流出。其中,信息技術板塊淨流出超250億元,位居首位;此外,醫療保健、工業、金融等板塊資金淨流出額亦較多。
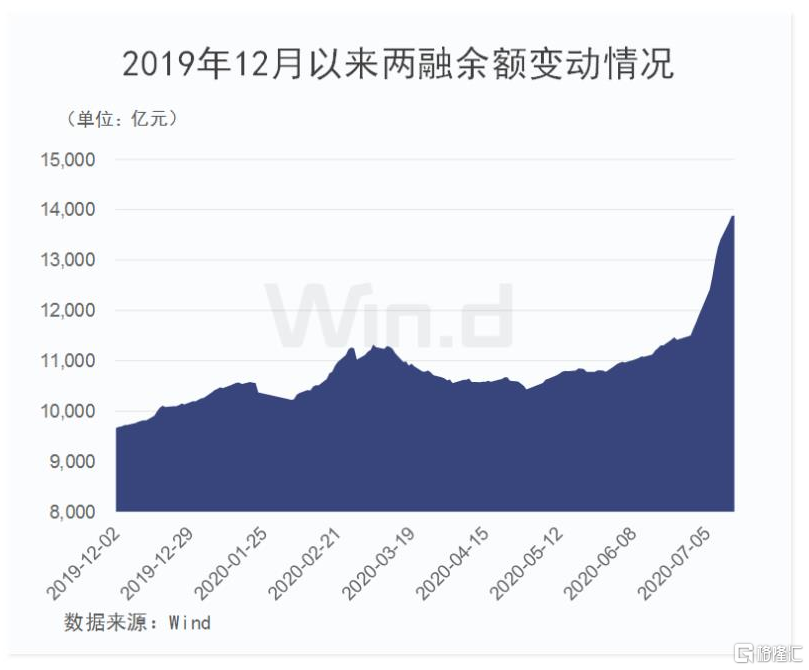
兩融餘額7月以來增逾2200億
近期,兩融餘額快速增長。截至週三(7月15日),A股融資融券餘額為13888.58億元,較前一交易日的13877.85億元增加10.73億元。6月30日時,兩融餘額僅為11637.68億元,7月以來,累計增長超2200億元。
近日隨着A股市場出現調整,兩融餘額流入有放緩的跡象。
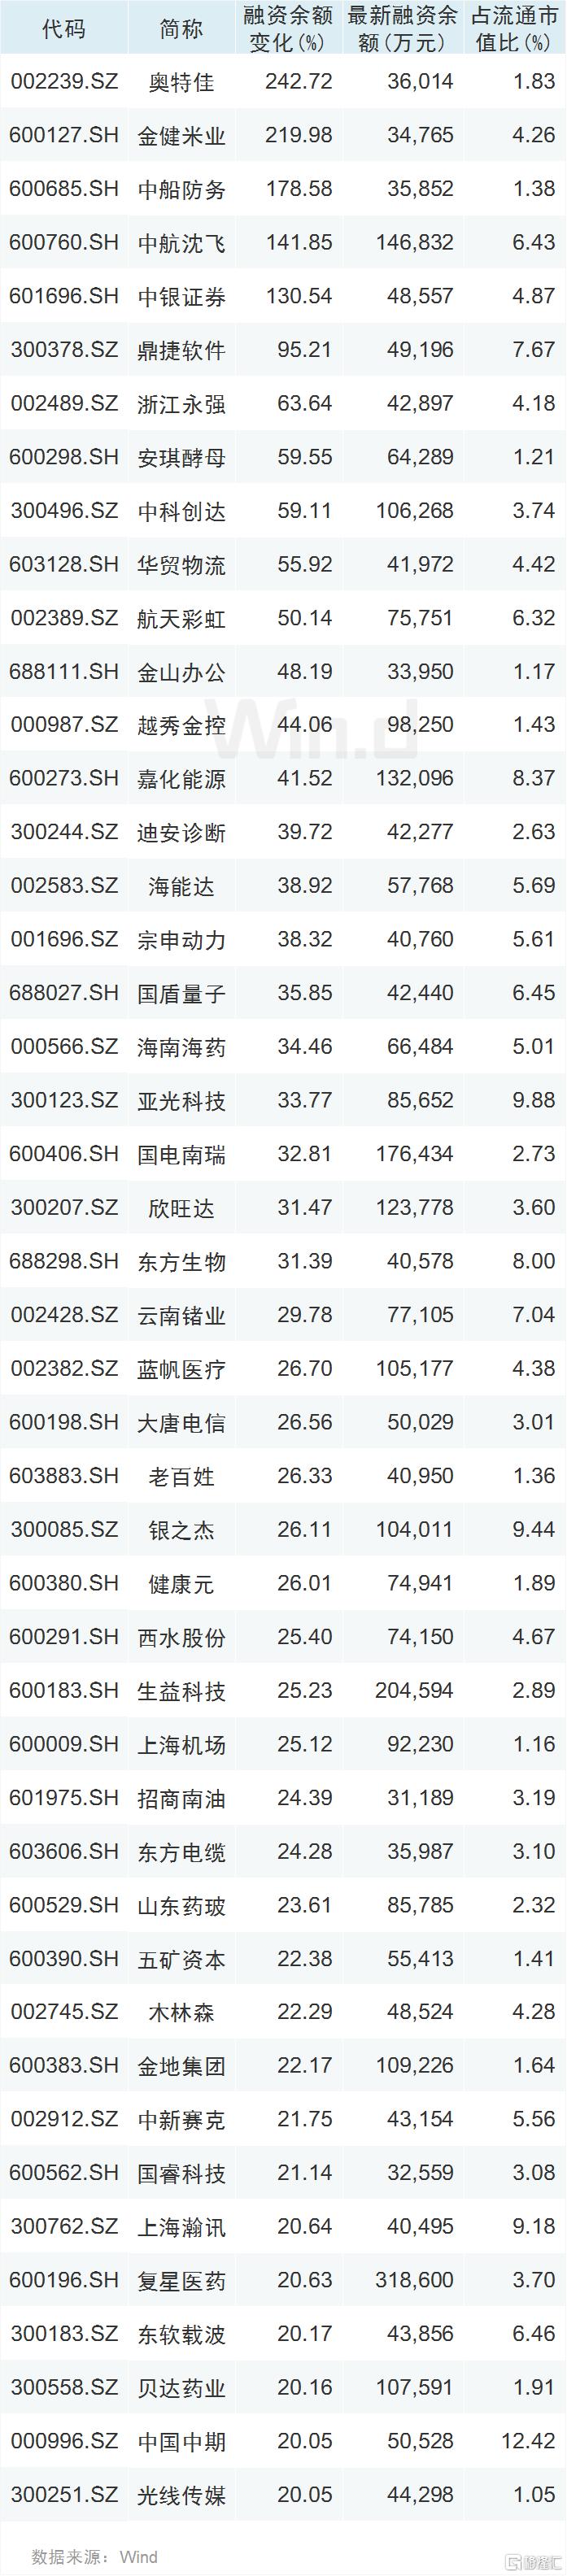
與此同時,部分公司融資餘額大幅攀升。Wind統計顯示,本週前三天,有46只個股融資餘額增長超過20%、最新融資餘額超3億元,且佔流通市值比超過1%。具體來看,奧特佳融資餘額增幅達242.72%,位居第一;此外,金健米業、中船防務、中航沈飛、中銀證券、鼎捷軟件、浙江永強、安琪酵母、中科創達、華貿物流、航天彩虹多家公司融資餘額增幅均超過50%。
Follow us
Find us on
Facebook,
Twitter ,
Instagram, and
YouTube or frequent updates on all things investing.Have a financial topic you would like to discuss? Head over to the
uSMART Community to share your thoughts and insights about the market! Click the picture below to download and explore uSMART app!

Disclaimers
uSmart Securities Limited (“uSmart”) is based on its internal research and public third party information in preparation of this article. Although uSmart uses its best endeavours to ensure the content of this article is accurate, uSmart does not guarantee the accuracy, timeliness or completeness of the information of this article and is not responsible for any views/opinions/comments in this article. Opinions, forecasts and estimations reflect uSmart’s assessment as of the date of this article and are subject to change. uSmart has no obligation to notify you or anyone of any such changes. You must make independent analysis and judgment on any matters involved in this article. uSmart and any directors, officers, employees or agents of uSmart will not be liable for any loss or damage suffered by any person in reliance on any representation or omission in the content of this article. The content of the article is for reference only and does not constitute any offer, solicitation, recommendation, opinion or guarantee of any securities, virtual assets, financial products or instruments. Regulatory authorities may restrict the trading of virtual asset-related ETFs to only investors who meet specified requirements. Any calculations or images in the article are for illustrative purposes only.
Investment involves risks and the value and income from securities may rise or fall. Past performance is not indicative of future performance. Please carefully consider your personal risk tolerance, and consult independent professional advice if necessary.


