山西汾酒:一季度净利大增近40%,股价迈入百元门槛
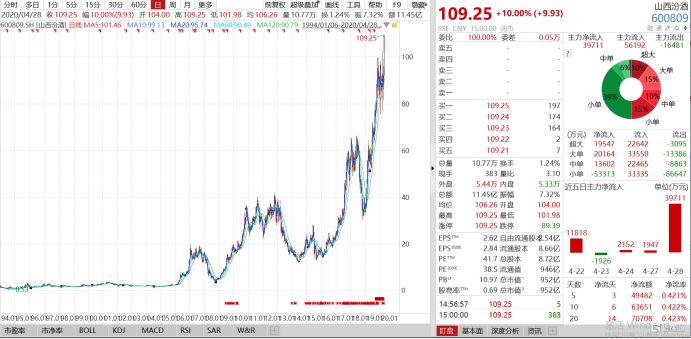
4月28日,山西汾酒(600809.SH)因业绩大增利好,股价封板涨停,报收109.25元,股价创新高,总市值952亿元。今年该股年初至今累涨21.8%,今天首次迈入百元股行列,这是白酒板块中继贵州茅台、五粮液、古井贡酒后的第4只百元股。
 来源:Wind
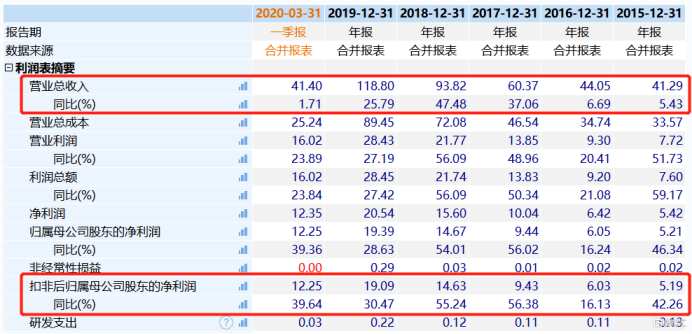
来看业绩,山西汾酒2019年实现营收118.8亿元,归母净利润19.09亿元,较上年同比增长25.79%、30.47%;净利润增长主要受益于其主营产品销售增加及其毛利提高。
 来源:Wind
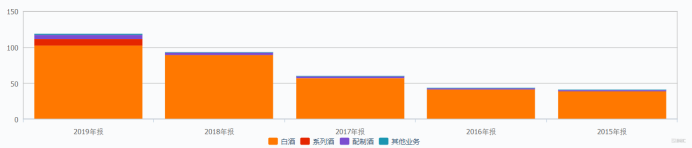
营收分布来看,白酒(包括青花汾酒、巴拿马金奖、老白汾酒等系列)占主导地位,销售收入102.97亿元,占总营收87%,较上年增长27.65%;其次是2019年新生产的产品系列酒(包括杏花村酒系列等),其销售收入9亿元,占总营收8%。显示主品牌市场低位的同时新品酒类的加入让山西汾酒的品牌竞争力继续提高。
 来源:Wind
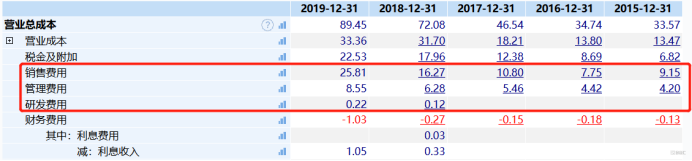
公司上年在三费方面普遍较往年上涨。其中,销售费用25.81亿元,较上年增长55.74%,系广告宣传费及销售人员薪酬等增加所致;管理费用8.55亿元,较上年增长22.53%,系本期研发人工费、材料费增加所致;研发费用0.22亿元,较上年增长83.11%,系本期利息收入大幅增加所致。
 来源:Wind
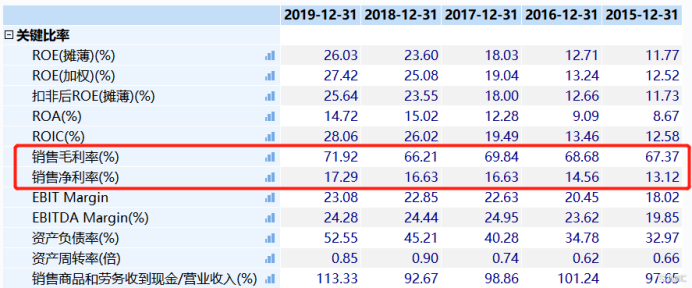
2019年,山西汾酒的销售毛利率和净利率分别为71.92%、17.29%,较上年提升5.71%、0.66%。其中,销售毛利率的增长主要受益于高端白酒业务占比提升,致使整体毛利率水平拉高也显示了其良好的运营能力和产品管理能力。
 来源:Wind
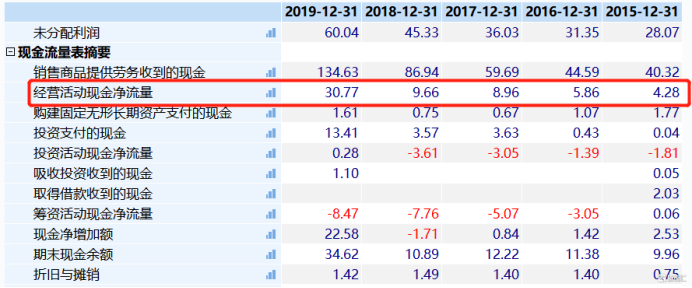
现金流与资金方面,山西汾酒在2019年发生经营活动流量较上年增长221.92%至30.77亿元,主要归因于本期销售收入增加以及票据贴现所致。另外,其货币资金较上年增长178.8%至39.64亿元,创公司上市以来持有货币资金最高值。
 来源:Wind
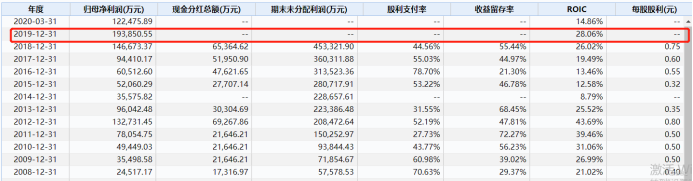
在分红派息上,山西汾酒表现得非常慷慨。2019年度,公司拟向全体股东每10股派发现金红利9元(含税),合计派发现金分红7.84元,占公司本年归母净利润的比例为40.43%。
 来源:Wind
另外,在2020年第一季度,公司实现营收41.40亿元,归母净利润12.25亿元,分别同比增长1.71%、39.36%。公司称,净利润的增加是由于疫情影响,本期商品酒产量减少,相应缴纳消费税等税费减少所致。
值得一提的是,山西汾酒在2020年第一季度首次实现省外的销售收入超过省内的销售收入,主要得益于渠道持续扩张,省外增量市场抗风险能力较省内存量市场更强。
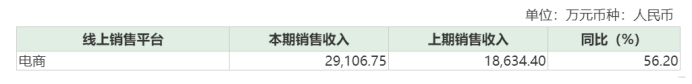
同时,公司还致力于拓展线上营销模式,并取得不错的成绩。主要表现在其上年电商渠道全年累计粉丝达到302.79万人,业绩收入2.91亿元,较上年增长56.2%,增长速度居行业前列。
 来源:山西汾酒2019年年报
Follow us
Find us on
Facebook,
Twitter ,
Instagram, and
YouTube or frequent updates on all things investing.Have a financial topic you would like to discuss? Head over to the
uSMART Community to share your thoughts and insights about the market! Click the picture below to download and explore uSMART app!

Disclaimers
uSmart Securities Limited (“uSmart”) is based on its internal research and public third party information in preparation of this article. Although uSmart uses its best endeavours to ensure the content of this article is accurate, uSmart does not guarantee the accuracy, timeliness or completeness of the information of this article and is not responsible for any views/opinions/comments in this article. Opinions, forecasts and estimations reflect uSmart’s assessment as of the date of this article and are subject to change. uSmart has no obligation to notify you or anyone of any such changes. You must make independent analysis and judgment on any matters involved in this article. uSmart and any directors, officers, employees or agents of uSmart will not be liable for any loss or damage suffered by any person in reliance on any representation or omission in the content of this article. The content of the article is for reference only and does not constitute any offer, solicitation, recommendation, opinion or guarantee of any securities, virtual assets, financial products or instruments. Regulatory authorities may restrict the trading of virtual asset-related ETFs to only investors who meet specified requirements. Any calculations or images in the article are for illustrative purposes only.
Investment involves risks and the value and income from securities may rise or fall. Past performance is not indicative of future performance. Please carefully consider your personal risk tolerance, and consult independent professional advice if necessary.


