新希望(000876.SZ):營收與盈利反向表現但財務狀況良好,加速產能佈局保持產量穩增長(太平洋證券)
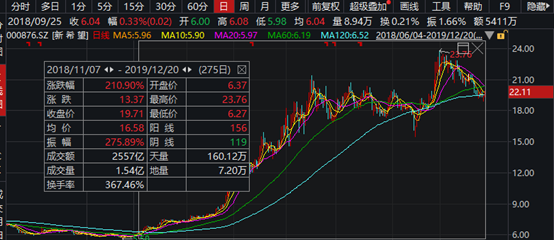
我們常説:新的一年播種新的希望,今天再次打開盤面嘴角依然瘋狂上揚。通過信息瞭解到,新希望股票上市公司主要立足於農牧產業、及其注重穩健發展,業務涉及飼料、養殖、肉製品及金融投資、商貿等。公司還獲得農
業產業化國家重點龍頭企業、全國食品放心企業等榮譽稱號,可見其地位不凡。在去年的11月7日,格隆匯--會員專區--研報掘金板塊文章就有覆蓋過該只股票,現在想想,當時入股了的朋友們持股到現在怕是睡覺也會笑,

小編害怕的蹲在角落瑟瑟發抖,彷彿受到了驚嚇,畢竟漲跌幅已經漲達200多個點了!
您對這隻股票持怎樣的看法呢?評論區見!
接下來我們重温一下當時的研報分析:
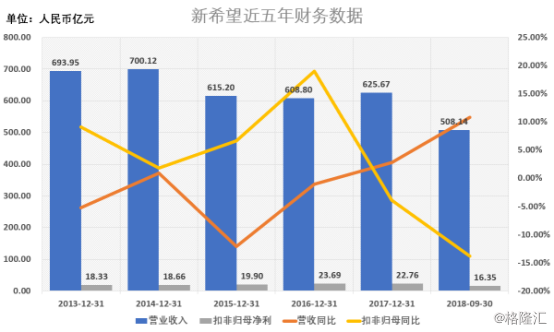
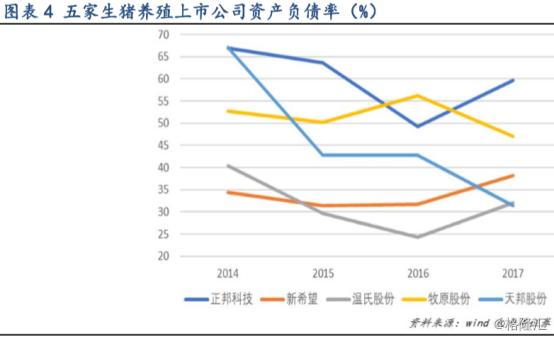
1 營收規模穩增長但盈利增速反向下行,負債低於同業水平公司財務壓力較小
根據公司2018年前三季度財報顯示,公司實現營收508.14億元,同比增長10.8%;實現淨利22.58億元,實現扣非歸母淨利16.35億元,同比下滑13.83%。但在公司近五年的營收及扣非歸母淨利增速走勢上看,公司營收雖仍保持穩增長態勢,但扣非歸母淨利增速的反向下行。
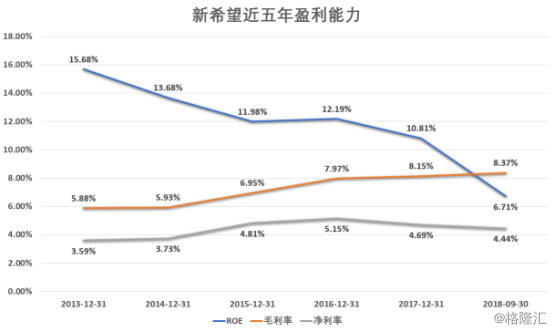
2013年至2017年,公司現金流充沛,有充足的資本金用於擴張。同時公司的資產負債率處於行業較低水平,債務負擔較小,融資能力強。
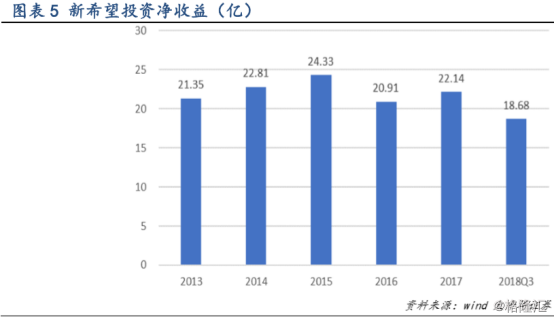
公司每年從民生銀行獲取高額投資收益,每年穩定在20億以上。同時,飼料、肉禽、食品等業務板塊與生豬養殖形成良好互補,有助於平抑週期波動的不利影響。
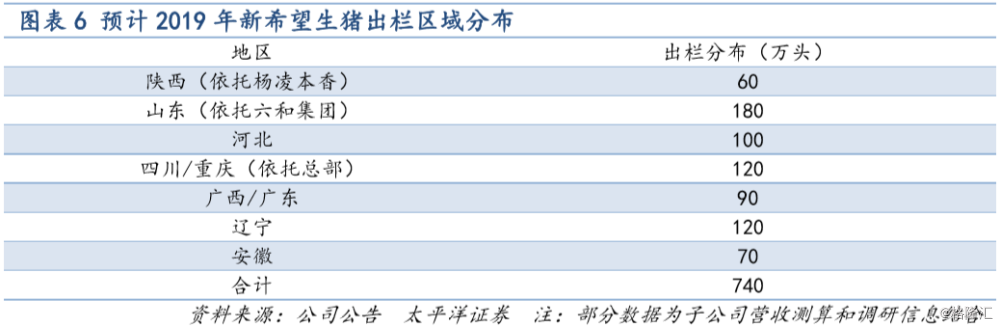
2 提前搶佔生豬養殖用地,預計年底投產產能達700萬頭
公司未雨綢繆,已搶先一步在全國範圍內(尤其是環渤海、長三角、珠三角等銷區)儲備大量可用於生豬養殖的土地。2018半年報提出,2018上半年已完成約2000萬頭產能佈局,其中已投產產能達400萬頭,在建產能達400萬頭,預計到2018年底可投產產能將達700萬頭。
公司對生豬產能佈局規劃了四大核心區域:環渤海區域(主要對應京津市場消費區);魯南、蘇北、皖北區域(主要對應長三角消費區);廣西和廣東西部(主要對應珠三角消費區);川渝地區。在此之外還有陝西區域,以楊凌本香為基礎輻射西北區域。
5.3 去年年底仔豬行情拖累出欄成本,區域發展不均衡加速短板地區發展進程
2018上半年自繁自養和“公司+農户”的成本約為12.20~12.30元/公斤,由於2017年底仔豬價格較高,導致2018上半年外購仔豬放養模式出欄肥豬的成本較高,約為12.6元/公斤。
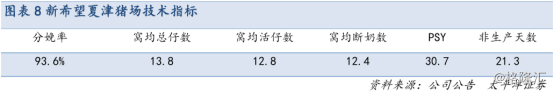
公司整體的養殖成本位於行業領先水平,尤其是代表國內生豬養殖最高水準的新希望夏津豬場,技術和成本不僅國內領先,甚至具有國際競爭力。由於目前公司的區域發展不均衡,其他各地的生產成績和養殖成本均在快速進步,爭取向夏津看齊。
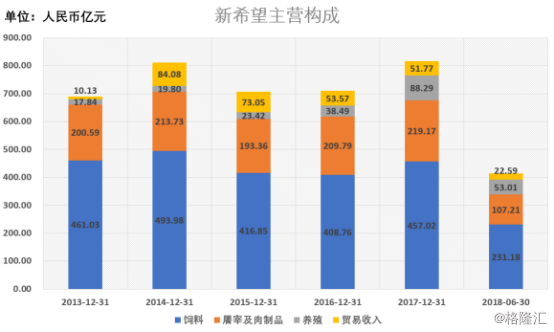
4 飼料仍為主營主要構成,整體產能及毛利表現穩定
而從公司主營構成中,截至2018上半年,飼料實現營收231.18億元,佔55.84%;屠宰及肉製品實現營收107.21億元,佔25.9%;養殖實現營收53.01億元,佔12.8%;貿易收入實現營收22.59億元,佔5.46%。飼料目前仍為公司主營主要構成,因此原材料成本變動對公司主營變化影響將較為明顯。
近些年飼料產量基本穩定在1500萬噸左右。各飼料種類佔比基本保持雞:豬:水產=7:2.5:1。
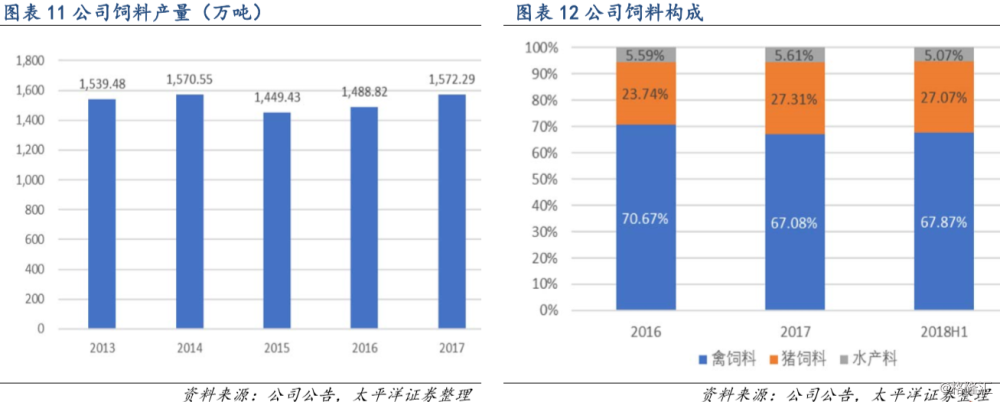
公司飼料毛利率自2016年起維持在6%左右。公司飼料產能及毛利逐漸保持平穩態勢。
Follow us
Find us on
Facebook,
Twitter ,
Instagram, and
YouTube or frequent updates on all things investing.Have a financial topic you would like to discuss? Head over to the
uSMART Community to share your thoughts and insights about the market! Click the picture below to download and explore uSMART app!

Disclaimers
uSmart Securities Limited (“uSmart”) is based on its internal research and public third party information in preparation of this article. Although uSmart uses its best endeavours to ensure the content of this article is accurate, uSmart does not guarantee the accuracy, timeliness or completeness of the information of this article and is not responsible for any views/opinions/comments in this article. Opinions, forecasts and estimations reflect uSmart’s assessment as of the date of this article and are subject to change. uSmart has no obligation to notify you or anyone of any such changes. You must make independent analysis and judgment on any matters involved in this article. uSmart and any directors, officers, employees or agents of uSmart will not be liable for any loss or damage suffered by any person in reliance on any representation or omission in the content of this article. The content of the article is for reference only and does not constitute any offer, solicitation, recommendation, opinion or guarantee of any securities, virtual assets, financial products or instruments. Regulatory authorities may restrict the trading of virtual asset-related ETFs to only investors who meet specified requirements. Any calculations or images in the article are for illustrative purposes only.
Investment involves risks and the value and income from securities may rise or fall. Past performance is not indicative of future performance. Please carefully consider your personal risk tolerance, and consult independent professional advice if necessary.


