凱倫股份:經營性淨現金流持續為負,配股補充流動資金

凱倫股份(300715)日前披露了《配股提示性公告》,此次配股以公司2019年12月19日總股本為基數,每10股配售3股,可配售39,549,900股,配售價格為12.64元/股。配股主要日期安排如下:
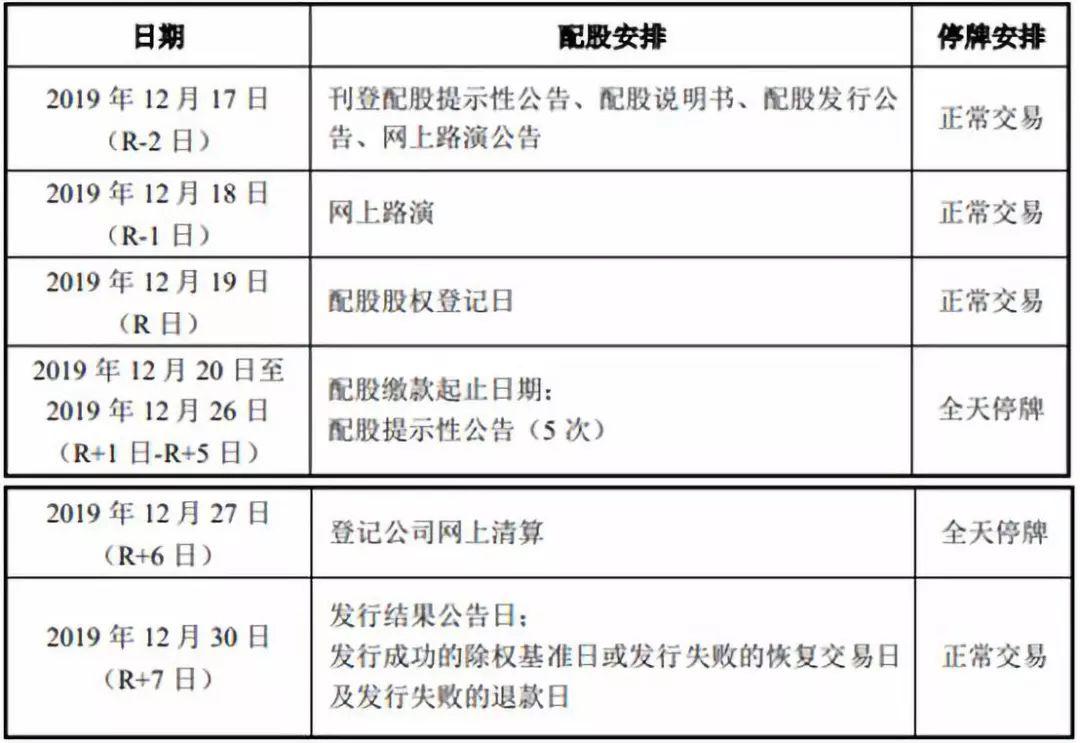
對比12月18日的收盤價24.14元/股,凱倫股份這次12.64元/股的配股價折價超過四成。
首次再融資:主要用於補充流動資金
這是凱倫股份上市後首次再融資。
2017年10月,凱倫股份在創業板上市,IPO募集資金總額2.25億;扣除發行費用後,募資淨額約1.93億元。募集資金主要投資於新型高分子防水卷材生產線建設項目、唐山防水卷材生產基地項目及防水材料技術研發及培訓中心項目。
截至2019年6月30日,公司已累計投入募集資金總額為14,994.65萬元,募集資金賬户餘額為4,483.62萬元(含利息收入扣除銀行手續費合計金額224.90萬元)。
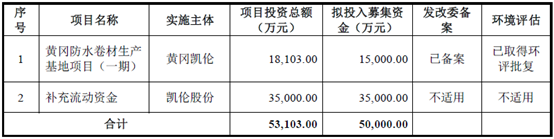
公告顯示,公司此次配股募集資金總額預計不超過5億元,將用於補充流動資金及黃岡防水卷材生產基地項目(一期),擬使用募集資金額分別為3.5億元及1.5億元。
公司控股股東凱倫控股及其一致行動人蘇州綠融投資合夥企業(有限合夥)承諾將以現金方式按照持股比例認購公司本次配股的可配售股份,將認購1779.3萬股,佔總配售量的44.99%。
營收及利潤快速增長
凱倫股份主要產品為新型建築防水材料,主要應用於高鐵、地鐵、隧道、人防、地下管廊、機場、核電、水利、糧庫等公共設施與基礎設施建設工程和工業民用建築。
年度財務數據顯示,2016年、2017年及2018年,凱倫股份營收分別為2.69億元、3.94億元及6.19億元,歸母淨利潤分別為4023.7萬元、4457.02萬元及6510.28萬元。2017年及2018年,公司營收增速分別為46.57%及57.09%,歸母淨利潤增速分別為10.77%及46.07%。
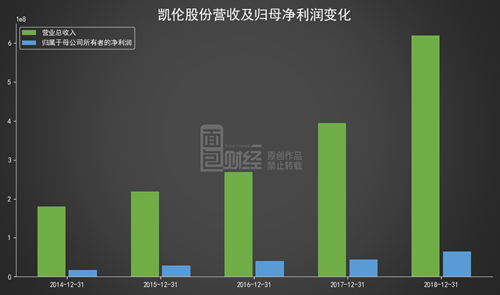
2019年前三季度,公司營收6.9億元,同比增長66.43%;歸母淨利潤7115.31萬元,同比增長74.88%。期內,非經常性損益378.6萬元,扣非後歸母淨利潤6736.71萬元,同比增長85.85%。
經營性淨現金流與利潤背離
利潤高速增長,但公司經營性淨現金流持續下滑。
2016-2018年,凱倫股份經營性淨現金流分別為33.86萬元、-148.96萬元及-2410.09萬元,與同期淨利潤4023.7萬元、4457.02萬元及6510.28萬元相比,變動方向背離,淨利含金量(經營現金淨流量/淨利潤)分別為0.01、-0.03及-0.37。
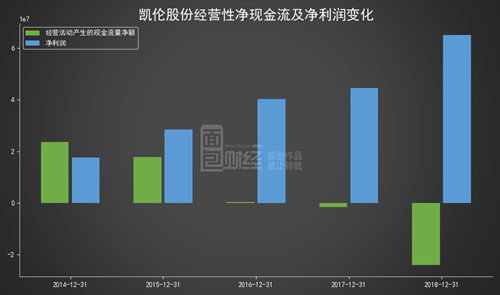
2019年前三季度,公司經營性現金淨流出1.16億元,同期淨利潤為7115.31萬元,淨利含金量為-1.64。經營性淨現金流與淨利潤之間的差值進一步擴大。
根據2019年三季報,公司經營性淨現金流下滑主要系報告期內公司原材料採購付款支出增長,以及支付履約保證金所致。
存貨及應收款攀升
上市之後,公司存貨及應收賬款規模持續增長。2017年到2018年,存貨由4125.44萬元增加至8056.36萬元,應收賬款由1.71億元增加至3.11億元。
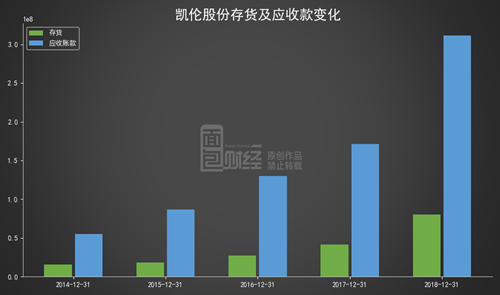
截止2019年三季度末,公司存貨1.73億元,應收賬款3.92億元,較年初分別增長115.02%及25.75%。存貨及應收賬款在總資產中的佔比分別為12.81%及28.96%。
2019年三季報顯示,公司存貨增加主要系報告期內公司銷售規模擴大,提前儲備原材料、庫存商品,以及隨着銷售增長,發出商品隨之增長所致。
2019年A股配股情況
根據公開的信披數據整理,除凱倫股份外,今年以來有10家上市公司進行配股。其中,隆基股份(601012)及金風科技(002202)募資總額較高,分別為38.75億及38.28億。
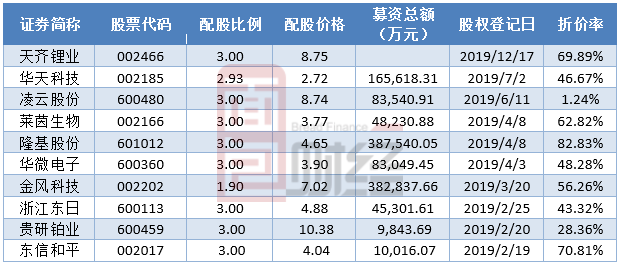
以各公司配股價格與股權登記日股價相比計算折價率,10家公司折價率平均數及中位數分別為51.05%及52.27%。這其中隆基股份折價率最高,達到82.83%;凌雲股份(600480)折價率最低,約1.24%。(YYL)
Follow us
Find us on
Facebook,
Twitter ,
Instagram, and
YouTube or frequent updates on all things investing.Have a financial topic you would like to discuss? Head over to the
uSMART Community to share your thoughts and insights about the market! Click the picture below to download and explore uSMART app!

Disclaimers
uSmart Securities Limited (“uSmart”) is based on its internal research and public third party information in preparation of this article. Although uSmart uses its best endeavours to ensure the content of this article is accurate, uSmart does not guarantee the accuracy, timeliness or completeness of the information of this article and is not responsible for any views/opinions/comments in this article. Opinions, forecasts and estimations reflect uSmart’s assessment as of the date of this article and are subject to change. uSmart has no obligation to notify you or anyone of any such changes. You must make independent analysis and judgment on any matters involved in this article. uSmart and any directors, officers, employees or agents of uSmart will not be liable for any loss or damage suffered by any person in reliance on any representation or omission in the content of this article. The content of the article is for reference only and does not constitute any offer, solicitation, recommendation, opinion or guarantee of any securities, virtual assets, financial products or instruments. Regulatory authorities may restrict the trading of virtual asset-related ETFs to only investors who meet specified requirements. Any calculations or images in the article are for illustrative purposes only.
Investment involves risks and the value and income from securities may rise or fall. Past performance is not indicative of future performance. Please carefully consider your personal risk tolerance, and consult independent professional advice if necessary.


