You are browsing the Hong Kong website, Regulated by Hong Kong SFC (CE number: BJA907). Investment is risky and you must be cautious when entering the market.
韵达股份(002120.SZ)为何不打价格战了?
格隆汇 11-22 13:54

作者:徐霁 

来源: 斑马消费

11月19日,韵达股份披露2019年10月经营快报,当月,公司完成业务量8.65亿票,同比增长30.27%,单票收入3.24元,同比增长91.72%,导致当月快递业务收入同比增长149.96%至28.02亿元。

对比4家A股快递公司2019年10月的经营数据后发现,顺丰控股、圆通速递(600233.SH)、申通快递的单票收入均出现不同程度的下滑,只有韵达股份上涨。

2019年以来,韵达股份(002120.SZ)平均单票收入为3.24元,较去年前10月平均单票收入1.69元,增长近乎翻倍。

这其中有业务模式调整的原因,但仍然掩盖不了涨价的威力。

去年下半年开始,韵达股份就开始对部分地区的快递费用进行调整,每单涨价约0.5元。今年10月份,公司对外表示将调整快递价格,原因是“人力、物料以及运营成本攀升”。随后,因协同涨价涉嫌垄断,公司等被浙江市场监管局召开告诫会通报。

值得一提的是,快递行业第一梯队的内战日渐白热化,顺丰控股(002352.SZ)今年打响价格战,争抢电商件,多家快递公司跟进——“不怕通达涨价,就怕顺丰降价”。

实际上,此前多年,韵达股份才是快递行业价格战的老手,也成为公司在草莽时代崛起的秘诀。

公司创立于1999年,2017年1月借壳新海电气上市,采用枢纽分拨自营与末端网络加盟的模式经营快递业务。截至2019年6月底,公司在全国拥有3575个加盟商和30070个网点。

为了追赶顺丰、申通等行业老大哥,公司一再压低单票收入。

2013年-2018年,韵达股份的单票收入分别为3.68元、2.89元、2.29元、2.23元、2.04元、1.73元。

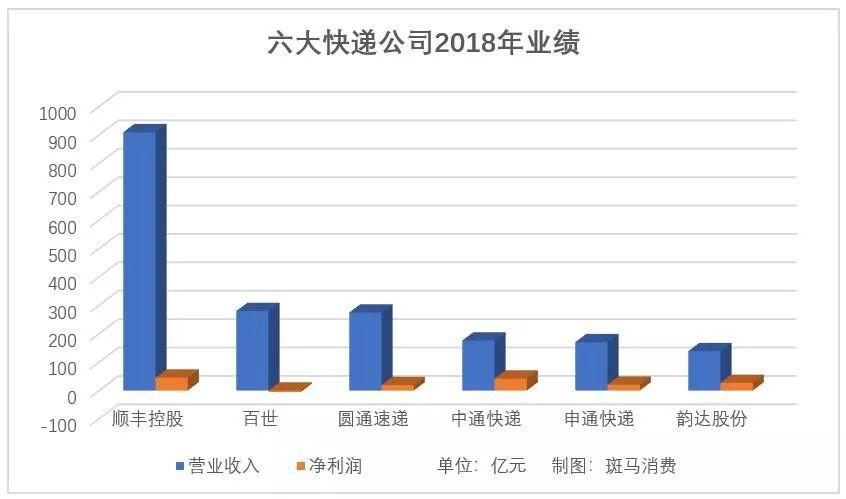
斑马消费梳理后发现,2018年顺丰控股、圆通速递、中通快递、申通快递(002468.SZ)的单票收入分别为23.18元、3.44元、1.81元、3.33元。

所以,即便韵达股份业务量(69.85亿单)排名第二,仅次于中通快递(85.2亿单),但公司营业收入在六大快递公司中最少。

进入2019年,韵达股份全面转身,调整业务模式、涨价、管控成本,打出一套组合拳。在获得市场份额后,规模诉求逐渐让位于收入和利润。

去年年底,公司对外宣布,将于2019年对派件模式进行调整,由原来的“揽派两端加盟商(网点)之间直接进行派件服务”调整为“统一由公司通过向派件端加盟商(网点)采购服务的形式向揽件端加盟商(网点)提供派件服务”。

这一调整,直接让公司多出一块派件服务收入,仅2019年上半年就高达69.18亿元。

在新政策之下,韵达股份2019年收入暴增。前不久披露的2019年三季报显示,公司营业收入242.53亿元,同比增长162.26%。

公司通过虚实两手扩充业绩,是为了真正让自己坐上快递行业“坐二望一”的宝座。

目前,韵达股份在中国快递行业业务量第二,收入增速第一,时效第三(仅次于顺丰和EMS),服务第二(投诉率数据,仅次于顺丰)。

但是,公司目前与行业老大顺丰控股的差距还很大。2019年前10月,顺丰控股平均单票收入22.69元,为韵达股份的7倍,单就这一点,公司可能无力追赶。

另外,顺丰控股近年依托其在快递业务上的优势,拓展相关业务。2019年3月份开始,顺丰供应链业务开始单列,近8个月产生36.43亿元的收入。

所以,韵达股份也在动心思,“以快递为核心,融合周边产业、新业务、新业态的多层次综合物流生态圈”。

企查查显示,目前韵达股份已经涉足跨境电商、保险经纪、餐饮管理、汽车服务等多种业务。

但是,即便是顺丰,在这个道路上也算是磕磕绊绊,王卫还被调侃为“零售风口练习生”。顺丰控股屡战屡败的,韵达股份就能成吗?

Follow us
Find us on Facebook, Twitter , Instagram, and YouTube or frequent updates on all things investing.Have a financial topic you would like to discuss? Head over to the uSMART Community to share your thoughts and insights about the market! Click the picture below to download and explore uSMART app!
Disclaimers
uSmart Securities Limited (“uSmart”) is based on its internal research and public third party information in preparation of this article. Although uSmart uses its best endeavours to ensure the content of this article is accurate, uSmart does not guarantee the accuracy, timeliness or completeness of the information of this article and is not responsible for any views/opinions/comments in this article. Opinions, forecasts and estimations reflect uSmart’s assessment as of the date of this article and are subject to change. uSmart has no obligation to notify you or anyone of any such changes. You must make independent analysis and judgment on any matters involved in this article. uSmart and any directors, officers, employees or agents of uSmart will not be liable for any loss or damage suffered by any person in reliance on any representation or omission in the content of this article. The content of the article is for reference only and does not constitute any offer, solicitation, recommendation, opinion or guarantee of any securities, virtual assets, financial products or instruments. Regulatory authorities may restrict the trading of virtual asset-related ETFs to only investors who meet specified requirements. Any calculations or images in the article are for illustrative purposes only.
Investment involves risks and the value and income from securities may rise or fall. Past performance is not indicative of future performance. Please carefully consider your personal risk tolerance, and consult independent professional advice if necessary.
uSMART
Wealth Growth Made Easy
Open Account