華能國際(600011.SH)三季報點評:業績符合預期,股息吸引力提升
作者:王威,於鴻光
來源: EBS公用環保研究
本 • 文 • 要 • 點
◆事件:華能國際發佈2019年三季報。2019年前三季度,公司營業收入1272億元,同比增長1.0%;歸母淨利潤53.9億元,同比增長171%;EPS 0.32元。其中2019Q3 公司營業收入438億元,同比增長1.2%;歸母淨利潤15.7億元,同比扭虧;EPS 0.10元。
◆Q3電量邊際回暖,市場化比例進一步提升
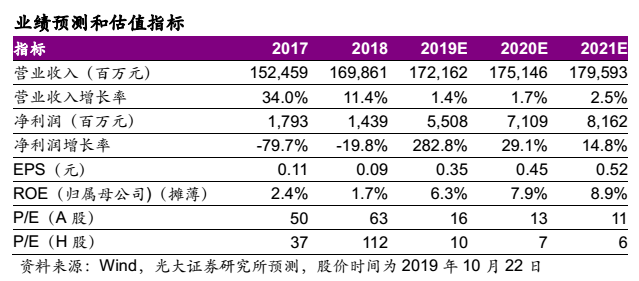
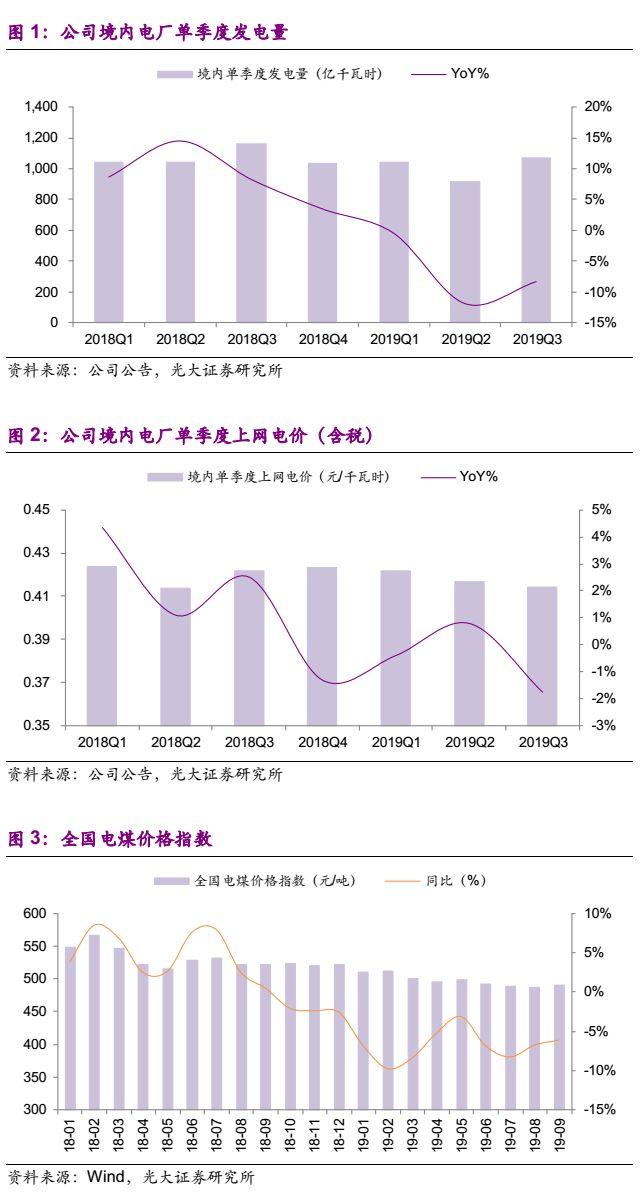
電量方面,受部分區域電力需求下滑、控煤、外來電增長等因素影響,2019年前三季度公司境內電廠發電量3022億千瓦時,同比下滑7.5%。分季度看,2019Q3公司境內電廠發電量1068億千瓦時,同比下滑8.3%,降幅較2019Q2收窄3.6個百分點;環比增長16.7%,增速較2018Q3提升4.5個百分點。電價方面,2019年前三季度公司境內電廠平均上網電價0.418元/千瓦時,同比小幅增長0.1%。我們測算2019Q3公司境內電廠平均上網電價約0.414元/千瓦時,同比/環比分別下滑1.8 / 0.6個百分點,我們認為主要原因為市場化交易電量比例提升。2019年前三季度,公司境內電廠市場化交易電量比例51.2%,同比提升10.9個百分點,較2019H1亦增加4.2個百分點,電力市場化比例進一步提升。我們認為,在“基準價+上下浮動”的市場化機制公佈後,二級市場對於電力股2020年的盈利預期過於悲觀,實際影響仍有待進一步跟蹤和觀察。
◆煤價下行疊加基數效應,Q3業績持續修復
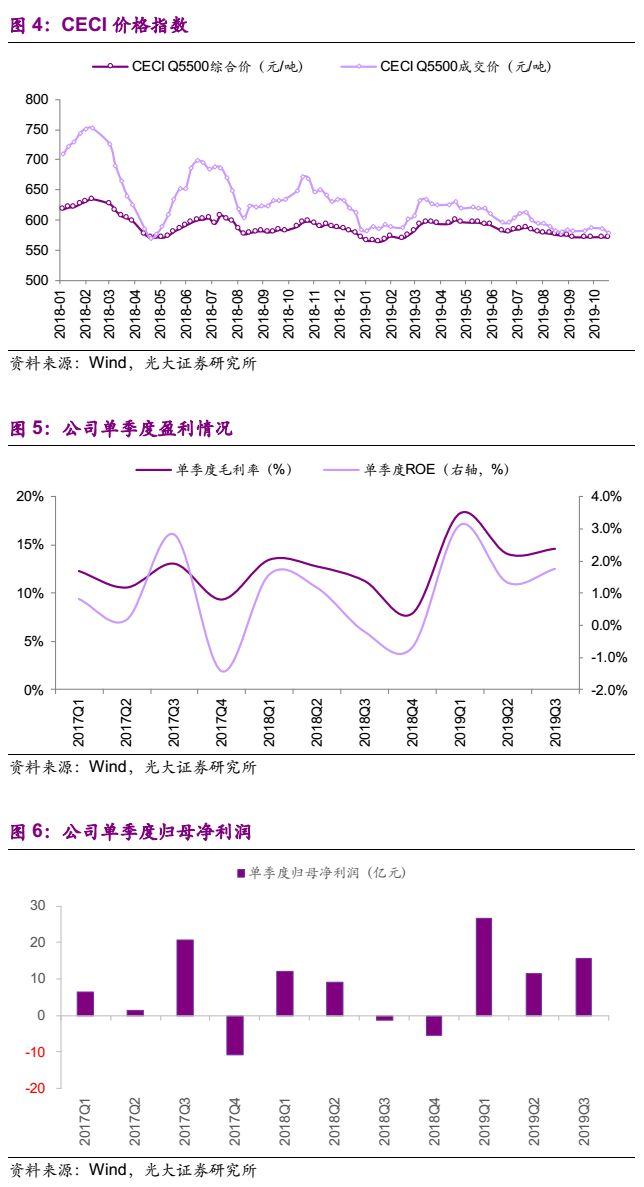
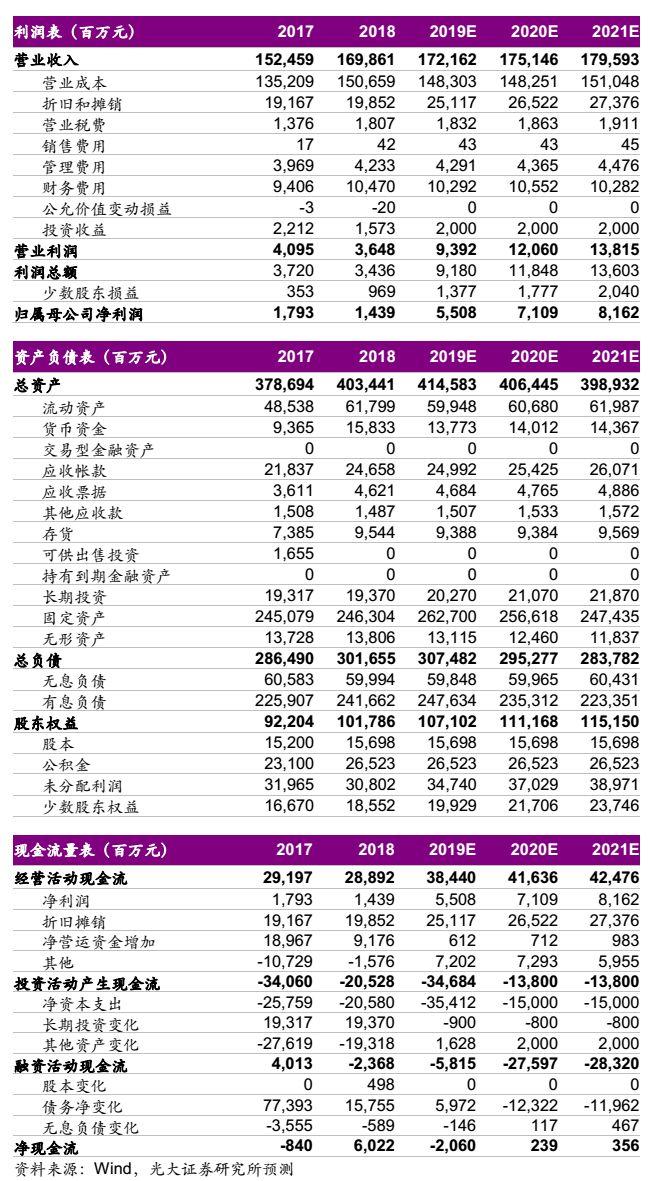
2019Q3煤炭供需關係持續改善,煤價總體處於下行區間。以全國電煤價格指數為例,2019Q3全國電煤價格指數均值約488元/噸,同比/環比下降7.1% / 1.5%。受益於成本改善,2019Q3公司毛利率14.6%,同比/環比增長3.4 / 0.5個百分點;單季度ROE 1.8%,同比由負轉正(2018Q3 ROE -0.2%),環比增長0.4個百分點。考慮到成本改善,疊加去年同期的低基數效應(詳見我們2018年10月的報告《三季度業績低於預期,期待業績彈性釋放——華能國際(600011.SH)2018年三季報點評》),2019Q3公司歸母淨利潤15.7億元,同比扭虧(2018Q3虧損1.4億元),環比增長34.8%。受2019Q3拉動,2019年前三季度公司歸母淨利潤同比增長171%。
◆分紅比例明確,股息吸引力提升
公司明確2018-2020年股東回報規劃,在滿足分紅條件的前提下“每年以現金方式分配的利潤原則上不少於當年實現的合併報表可分配利潤的70%且每股派息不低於0.1元人民幣”。我們以70%的現金分紅比例測算,對應華能國際(A)、華能國際(H)2019E的股息率分別為4.3%、7.3%,股息回報可觀。
◆盈利預測與投資評級
我們維持盈利預測,預計公司2019-2021年的歸母淨利潤分別為55.1、71.1、81.6億元,EPS分別為0.35、0.45、0.52元。當前股價對應華能國際(A)2019-2021年的PE分別為16、13、11倍,對應華能國際(H)2019-2021年的PE分別為10、7、6倍。公司作為火電龍頭,盈利回升趨勢確立,當前估值明顯處於歷史低位,重申華能國際(A)“買入”評級、華能國際(H)“買入”評級。
◆風險提示
上網電價超預期下行,動力煤價格超預期上漲,電力需求超預期下滑,匯兑損失過大,電力行業改革進度低於預期的風險等。
Follow us
Find us on
Facebook,
Twitter ,
Instagram, and
YouTube or frequent updates on all things investing.Have a financial topic you would like to discuss? Head over to the
uSMART Community to share your thoughts and insights about the market! Click the picture below to download and explore uSMART app!

Disclaimers
uSmart Securities Limited (“uSmart”) is based on its internal research and public third party information in preparation of this article. Although uSmart uses its best endeavours to ensure the content of this article is accurate, uSmart does not guarantee the accuracy, timeliness or completeness of the information of this article and is not responsible for any views/opinions/comments in this article. Opinions, forecasts and estimations reflect uSmart’s assessment as of the date of this article and are subject to change. uSmart has no obligation to notify you or anyone of any such changes. You must make independent analysis and judgment on any matters involved in this article. uSmart and any directors, officers, employees or agents of uSmart will not be liable for any loss or damage suffered by any person in reliance on any representation or omission in the content of this article. The content of the article is for reference only and does not constitute any offer, solicitation, recommendation, opinion or guarantee of any securities, virtual assets, financial products or instruments. Regulatory authorities may restrict the trading of virtual asset-related ETFs to only investors who meet specified requirements. Any calculations or images in the article are for illustrative purposes only.
Investment involves risks and the value and income from securities may rise or fall. Past performance is not indicative of future performance. Please carefully consider your personal risk tolerance, and consult independent professional advice if necessary.


