正荣地产(6158.HK):盈利持续增长,净利率小幅提升,维持“增持”评级
机构:西南证券
评级:增持
投资要点
业绩表现:2019年上半年,公司实现营业收入 136.5 亿,同比增长 10.8%,实现核心净利润 11.5 亿,同比增长 33.4%,实现归属于上市公司股东净利润 9.3亿,同比增长 11.1%。
盈利持续增长,净利率小幅提升:公司在上半年结算比例相对较低,导致营收仅增长 10.8%左右,从结构上看因为环渤海区域、海峡西岸及中西部地区结算比例提升,导致销售毛利率小幅下行 1.7 个百分点至 20.3%。但由于经营效率的提升,公司在报告期净利率反而同比上行 0.9 个百分点至 8.6%。上半年地产结算均价 16,821 元每平米,相比 2018 年均价小幅下降 3.6%,从结转面积口径海峡西安占比 42.5%、长三角占比 38.2%、环渤海占比 11.6%。
供货速度加快、下半年销售有望回归增长:报告期公司完成销售 586 亿,同比基本持平,销售均价为 15,392 元每平米。从结构上看一二线销售贡献占比 77%,从区域上看长三角贡献占比 56%、海峡西岸占比 18%、中西部占比 16%。1-7月完成销售额 687 亿,相当于全年销售目标 1300 亿的 53%,后期销售有一定压力,但考虑到公司产品标准化程度提高,供货速度加快,下半年货值充裕,销售增速有望在下半年体现,预计全年销售额 1300 亿,相当于 20.4%的增长。
聚焦二线和六大区域,土储货值充裕:公司按照“1+6+X”进行布局,报告期公司新增土储建面 323 万方,87%位于强二线城市。截止到上半年末,公司未结算口径土储建面 2634 万方,货值约 4500 亿,权益比 57%,平均土地成本为4624 元每平米。其中,一二线土储合计占比 71%,从面积口径看长三角占比38.2%、海西区域占比 27.9%、中部区域占比 14.9%、环渤海区域占比 12.4%。
净负债率走低、财务结构稳健:报告期末公司净负债率为 70.8%(根据认股事项后调整),相比 2018 年末降低 3.2 个百分点。期末有息负债规模 525.3 亿,其中外币债额度 8.9 亿美元、境内银行贷款 211.2 亿、境内其他贷款 154.6 亿,整体融资成本 7.6%,相比 2018 年下降 0.2 个百分点。
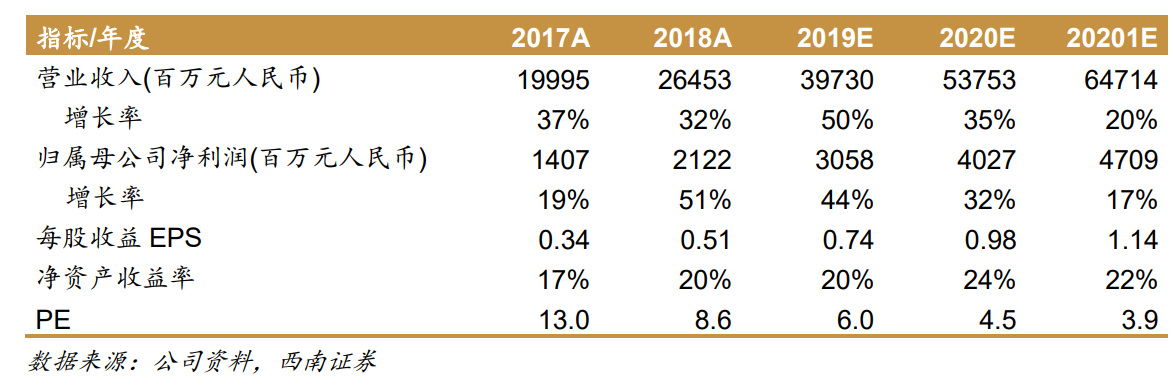
盈利预测与评级:预计公司 2019-2021 年 EPS 分别为 0.74、0.98 和 1.14 元,考虑公司业绩增长确定但短期偿债压力犹存,维持“增持”评级。
风险提示:下半年销售或低于预期、融资进一步收紧等风险。
Follow us
Find us on
Facebook,
Twitter ,
Instagram, and
YouTube or frequent updates on all things investing.Have a financial topic you would like to discuss? Head over to the
uSMART Community to share your thoughts and insights about the market! Click the picture below to download and explore uSMART app!

Disclaimers
uSmart Securities Limited (“uSmart”) is based on its internal research and public third party information in preparation of this article. Although uSmart uses its best endeavours to ensure the content of this article is accurate, uSmart does not guarantee the accuracy, timeliness or completeness of the information of this article and is not responsible for any views/opinions/comments in this article. Opinions, forecasts and estimations reflect uSmart’s assessment as of the date of this article and are subject to change. uSmart has no obligation to notify you or anyone of any such changes. You must make independent analysis and judgment on any matters involved in this article. uSmart and any directors, officers, employees or agents of uSmart will not be liable for any loss or damage suffered by any person in reliance on any representation or omission in the content of this article. The content of the article is for reference only and does not constitute any offer, solicitation, recommendation, opinion or guarantee of any securities, virtual assets, financial products or instruments. Regulatory authorities may restrict the trading of virtual asset-related ETFs to only investors who meet specified requirements. Any calculations or images in the article are for illustrative purposes only.
Investment involves risks and the value and income from securities may rise or fall. Past performance is not indicative of future performance. Please carefully consider your personal risk tolerance, and consult independent professional advice if necessary.


