融信中国(3301.HK)融筑美好进入均衡增长新阶段首次覆盖给予“买入”评级
机构:西南证券
评级:买入
目标价:13.03港元
销售跨越千亿后,稳固长三角区域基本盘。2019年1-5月,公司销售金额为466.5亿元,同比增长4.3%,前五月回款理想,去化率约为70%左右,继续保持在福州销售额排名第一,杭州销售额排名第三的销售排名。2018年公司实现合约销售额1218.8亿,同比增长73.4%,超额完成1200亿的销售目标,2014-2018年销售额复合增速为64.34%。公司注重核心城市及区域深耕,杭州、上海、西安销售额取得较大增长,2018年杭州单个城市销售额为403亿(2017年为167亿),在杭州权益销售额排行榜位列第二,上海2018年销售219亿(2017年为54亿元)。2019年公司稳固长三角基本盘,预计总可售货值超2000亿,全年销售目标为1400亿,同比增长15%。
区域布局全面,深耕城市集群。2019年1-5月,公司新增计容建面111.3万方,拿地权益比为50.1%,相较于2018年略有提升(2018年公司拿地权益比为41.0%)。截至2018年末公司总计土储2541万平,布局到八大城市群,主要储备位于长三角、海西和中部地区,总土储(按市值计算)80%位于一线、强二线城市,拿地实行以重点布局中心城市辐射周边区域的“N+1”战略,平均土地成本6356元/平方米,总土地成本占2018年底销售均价的比值约为29%。
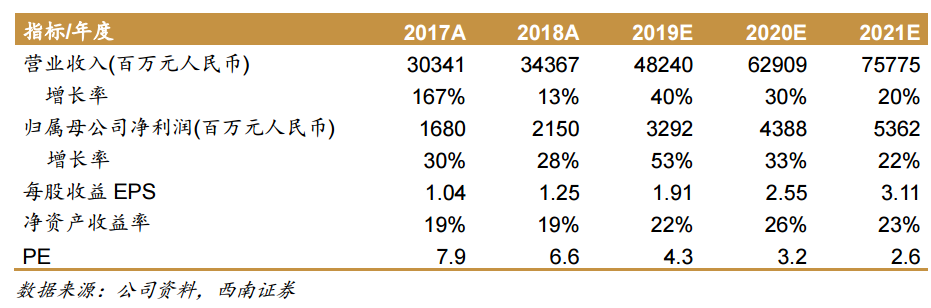
产品竞争力突出,契合改善型为主的市场。2018年公司平均销售均价为21672元/平方米,产品具有一定品牌溢价,在多个城市的拿地成本/销售成本在20-45%的区间。公司聚焦改善型高品质产品,希望通过合作实现品牌输出,追求规模、利润与杠杆之间的平衡,近几年公司逐渐加大了与龙头房企合作开发的比例。?盈利能力不断提升,可结算资源充沛。2015-2018年,公司营业收入复合增速为67%,2018年公司实现营业收入344亿元,同比增长13.3%,2018年末,公司预收账款期末值为639.6亿元,对2018年营业收入的覆盖倍数为1.9倍。2017、2018年公司实现归母净利润分别为16.8亿元和21.5亿元,同比分别增长30.0%和28.0%。2018年,公司毛利率为23.5%,同比提升了6.9个百分点。
稳步降杠杆,负债结构不断优化。近几年公司净负债率逐年改善,2018年末公司净负债率为105%左右,同比下降54个百分点,考虑到2019年总拿地预算为200亿元左右,以及业绩的逐步释放,我们认为2019年末公司净负债率有待改善至90%左右。随着公司进入均衡增长新阶段,负债结构得以优化,加权融资成本显著改善,截至2018年末公司加权融资成本为7.1%,而2015年末在10%左右。
盈利预测与评级。结合对标公司估值和公司的土储布局和杠杆逐步改善,给公司予2019年6倍PE,对应目标价13.03港元,首次覆盖给予“买入”评级。
风险提示:宏观调控风险、区域政策风险、项目合作风险、销售回款风险等。
Follow us
Find us on
Facebook,
Twitter ,
Instagram, and
YouTube or frequent updates on all things investing.Have a financial topic you would like to discuss? Head over to the
uSMART Community to share your thoughts and insights about the market! Click the picture below to download and explore uSMART app!

Disclaimers
uSmart Securities Limited (“uSmart”) is based on its internal research and public third party information in preparation of this article. Although uSmart uses its best endeavours to ensure the content of this article is accurate, uSmart does not guarantee the accuracy, timeliness or completeness of the information of this article and is not responsible for any views/opinions/comments in this article. Opinions, forecasts and estimations reflect uSmart’s assessment as of the date of this article and are subject to change. uSmart has no obligation to notify you or anyone of any such changes. You must make independent analysis and judgment on any matters involved in this article. uSmart and any directors, officers, employees or agents of uSmart will not be liable for any loss or damage suffered by any person in reliance on any representation or omission in the content of this article. The content of the article is for reference only and does not constitute any offer, solicitation, recommendation, opinion or guarantee of any securities, virtual assets, financial products or instruments. Regulatory authorities may restrict the trading of virtual asset-related ETFs to only investors who meet specified requirements. Any calculations or images in the article are for illustrative purposes only.
Investment involves risks and the value and income from securities may rise or fall. Past performance is not indicative of future performance. Please carefully consider your personal risk tolerance, and consult independent professional advice if necessary.


