“非洲手機之王”業績大爆雷!Q1淨利潤同比下滑近7成
“非洲手機之王”傳音控股一季報爆雷了。
淨利下滑近7成
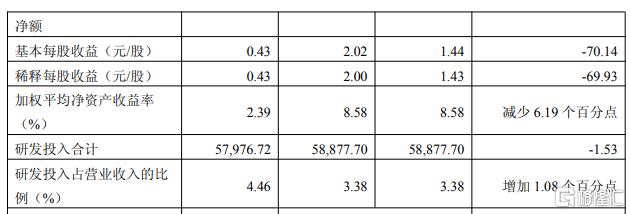
今年一季度,傳音控股實現營收爲130.04億元,同比下降25.45%;淨利潤爲4.9億元,同比下降69.87%;扣非淨利潤爲3.43億元,同比下滑74.64%。
同時,傳音控股經營活動產生的現金流連續惡化,今年一季度的淨額虧損高達7.41億元。
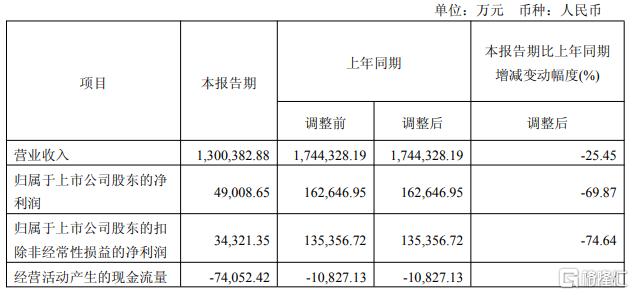
對於大幅下滑的原因,傳音控股表示,主要受市場競爭以及供應鏈成本綜合影響,營業收入及毛利額減少所致。
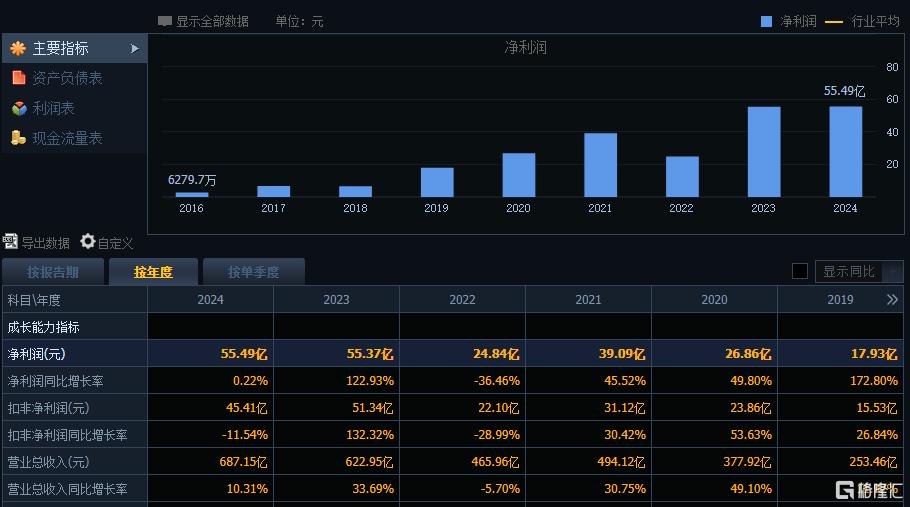
去年全年,傳音控股增收不增利,期間實現營收687.15億元,同比增長10.31%;歸母淨利潤爲55.49億元,同比僅增長0.22%;扣非淨利潤爲45.41億元,同比下降11.54%。
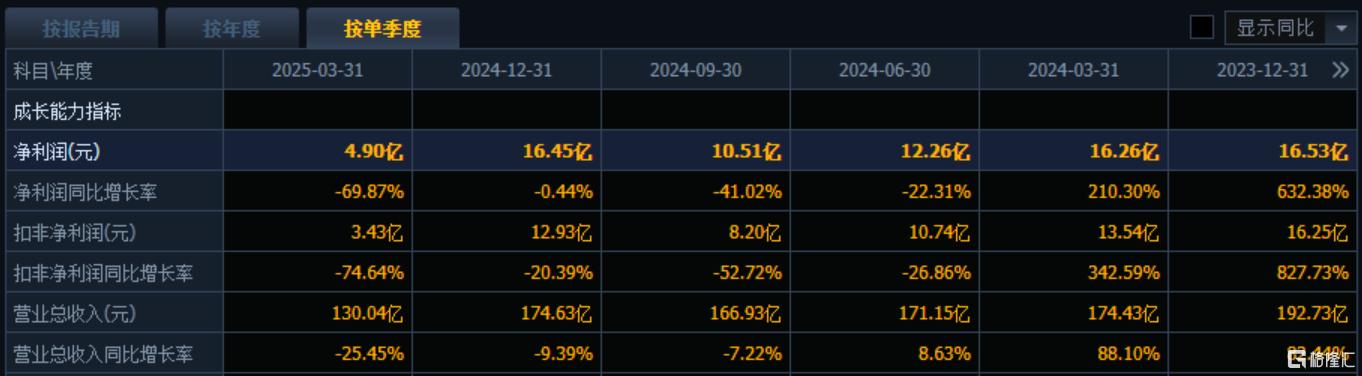
以往,傳音控股也曾出現過淨利潤連續幾個季度下滑的情況,而此輪業績“大變臉”始於去年二季度。
去年2、3季度,傳音控股的淨利潤同比下滑22.31%、a41.02%,隨後四季度勉強收平,今年一季度又出現大幅下降。
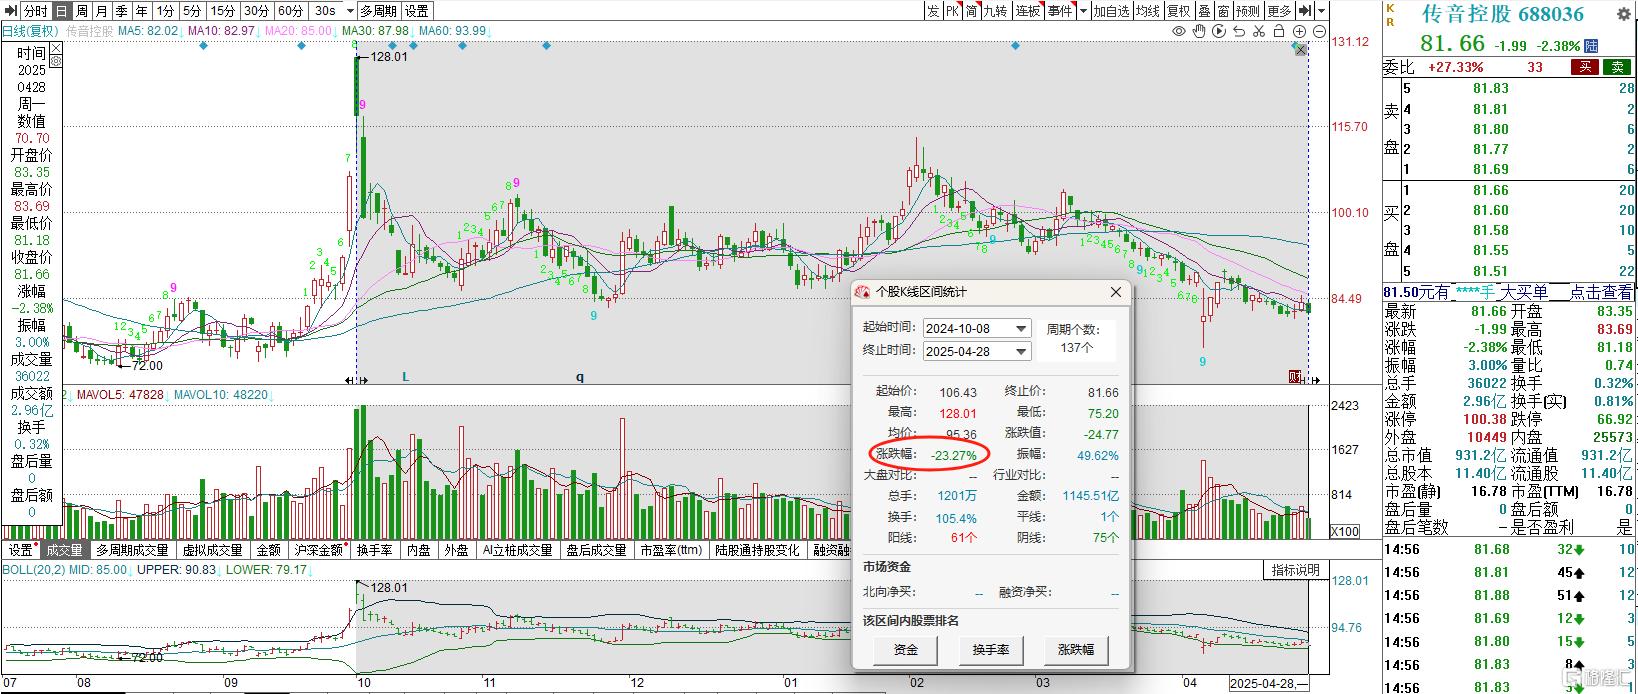
受此影響,公司股價一路走低,至今未能恢復。
自2024年10月8日以來,傳音控股的股價累計跌超23%,今日收盤報81.66元/股,總市值爲931.2億元。
競爭加劇
業績下滑的同時,傳音控股還面臨着行業競爭加劇的局面。
傳音控股的主要產品爲TECNO、itel和Infinix三大品牌手機,銷售區域主要集中在非洲、南亞、
東南亞、中東和拉美等全球新興市場國家。
以前,傳音控股憑藉着深深洞察本地用戶需求,牢牢把握着非洲市場,偏安一隅。
但近年來,隨着國內市場逐漸飽和,小米、OPPO、realme等手機品牌也將目光投向了非洲、東南亞等市場,他們開始向傳音學習。
知名市場調研機構Canalys數據顯示,截至2025年2月,非洲智能手機市場,傳音以51%的市場份額穩居第一,三星以19%的份額位居第二,小米則以10%排名第三。更令人關注的是,realme的增長率高達89%。
Follow us
Find us on
Facebook,
Twitter ,
Instagram, and
YouTube or frequent updates on all things investing.Have a financial topic you would like to discuss? Head over to the
uSMART Community to share your thoughts and insights about the market! Click the picture below to download and explore uSMART app!

Disclaimers
uSmart Securities Limited (“uSmart”) is based on its internal research and public third party information in preparation of this article. Although uSmart uses its best endeavours to ensure the content of this article is accurate, uSmart does not guarantee the accuracy, timeliness or completeness of the information of this article and is not responsible for any views/opinions/comments in this article. Opinions, forecasts and estimations reflect uSmart’s assessment as of the date of this article and are subject to change. uSmart has no obligation to notify you or anyone of any such changes. You must make independent analysis and judgment on any matters involved in this article. uSmart and any directors, officers, employees or agents of uSmart will not be liable for any loss or damage suffered by any person in reliance on any representation or omission in the content of this article. The content of the article is for reference only and does not constitute any offer, solicitation, recommendation, opinion or guarantee of any securities, virtual assets, financial products or instruments. Regulatory authorities may restrict the trading of virtual asset-related ETFs to only investors who meet specified requirements. Any calculations or images in the article are for illustrative purposes only.
Investment involves risks and the value and income from securities may rise or fall. Past performance is not indicative of future performance. Please carefully consider your personal risk tolerance, and consult independent professional advice if necessary.


