港股收評:恆指跌3.41%創近11年新低,汽車、內房股重挫
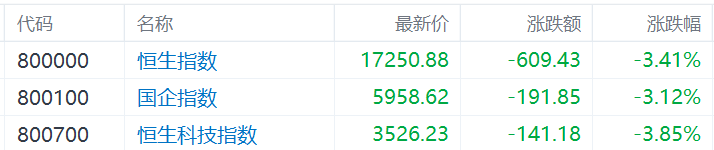
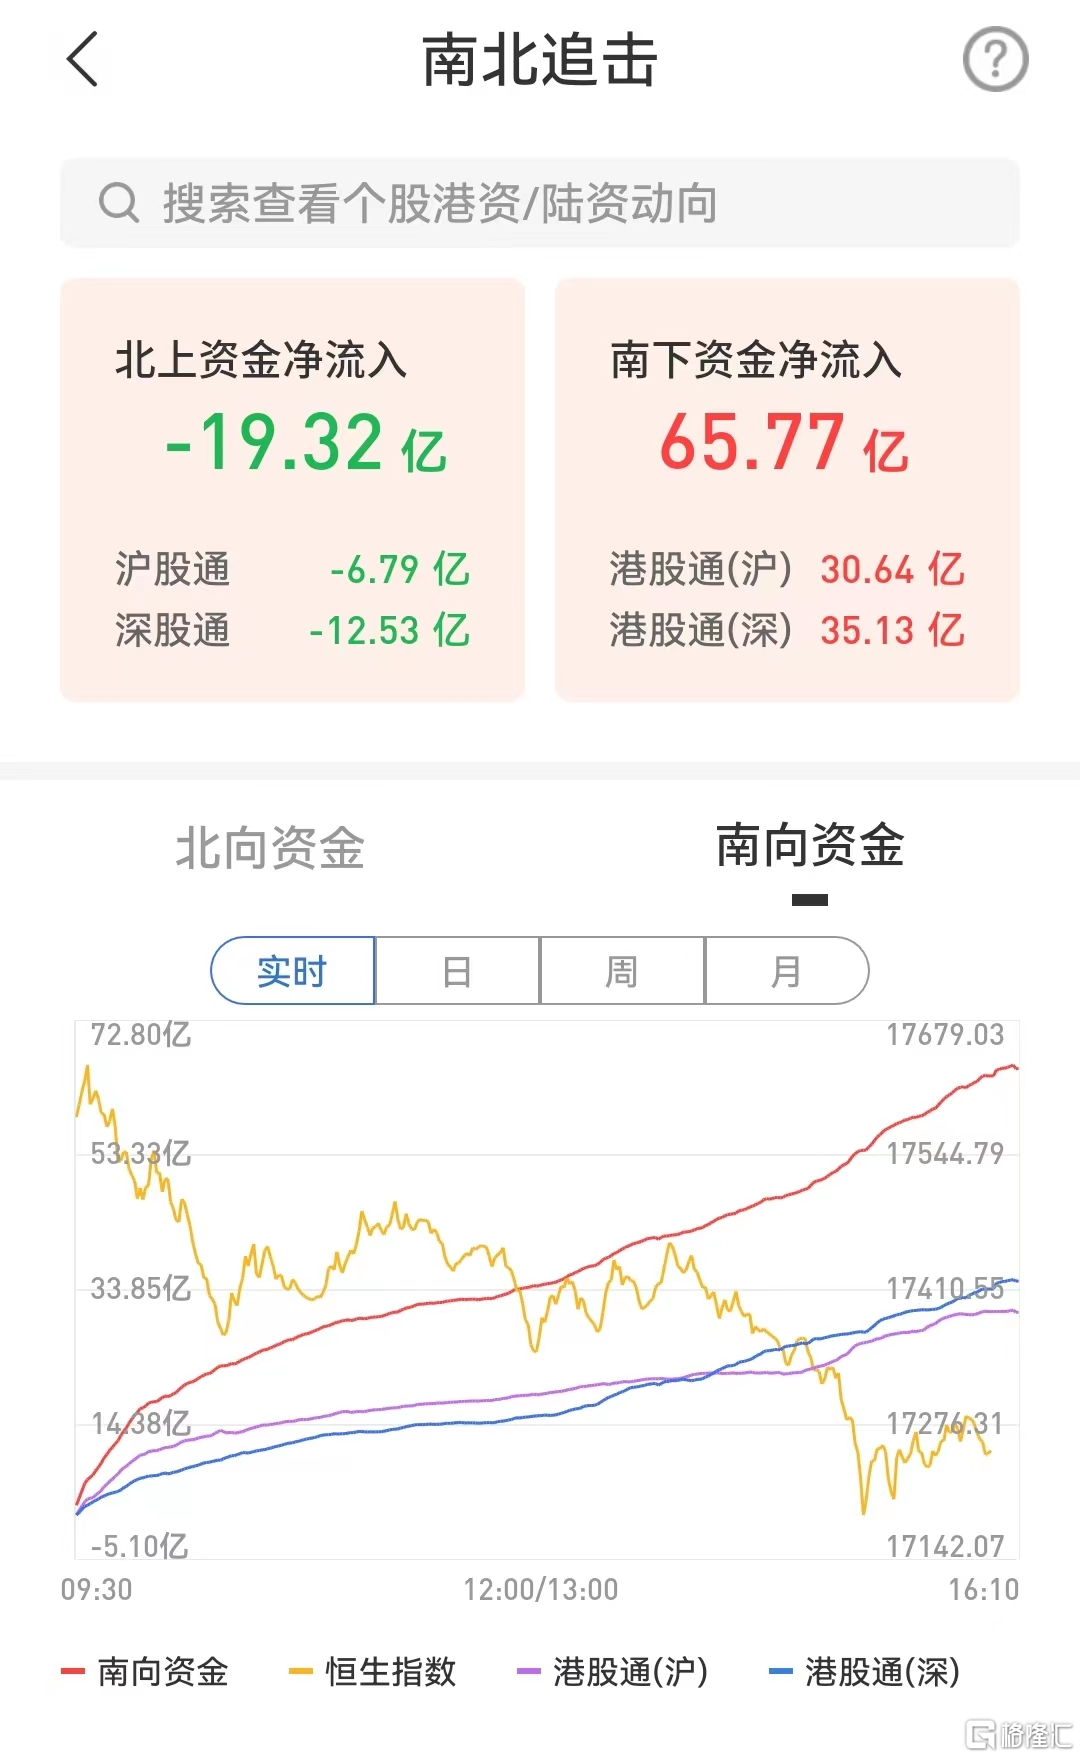
港股三大指數低開低走,尾盤跌幅進一步加大,行業板塊近乎全部下挫,市場情緒表現十分低落。截止收盤,恆指跌3.41%下挫超600點,續創2011年11月以來收盤新低;國指跌3.12%,恆生科技指數跌3.85%跌破3600點。南下資金逆勢淨流入65.77億港元,大市成交額為1087億港元。
盤面上,權重科技股全線下跌拖累大市下挫,京東、快手跌超5%,阿里巴巴跌超4%,小米、百度、美團、網易、騰訊均跌超2%;紙業股、汽車股大跌居前,玖龍紙業績後大跌超13%;美元指數持續上漲,黃金、鋁等有色金屬股齊跌;光伏股、建材水泥股、電力股、生物醫藥股、蘋果概念股、內房股與物管股等紛紛下跌。另一方面,惟國內零售股、化粧美容股個別板塊飄紅。
具體來看:
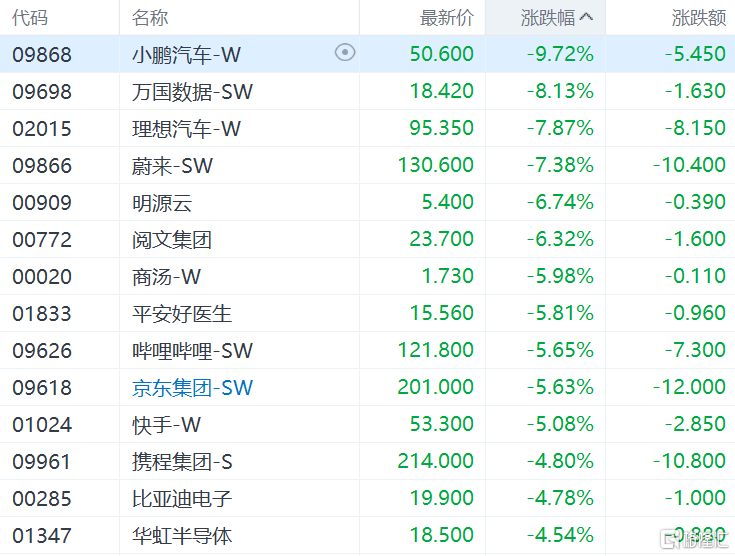
權重科技股全線下跌拖累大市下挫,京東、快手跌超5%,阿里巴巴跌超4%,小米、百度、美團、網易、騰訊均跌超2%。
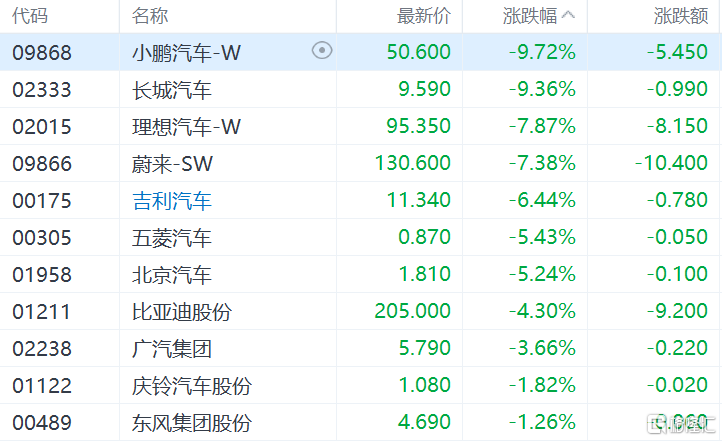
汽車板塊走低,小鵬汽車、長城汽車跌超9%,理想汽車、蔚來跌超7%,吉利汽車跌6.44%。
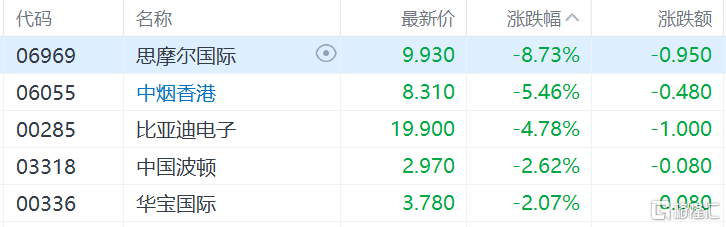
煙草概念股普跌,思摩爾國際跌8.73%,中煙香港跌5.46%,比亞迪電子跌4.78%,華寶國際、中國波頓跌超2%。
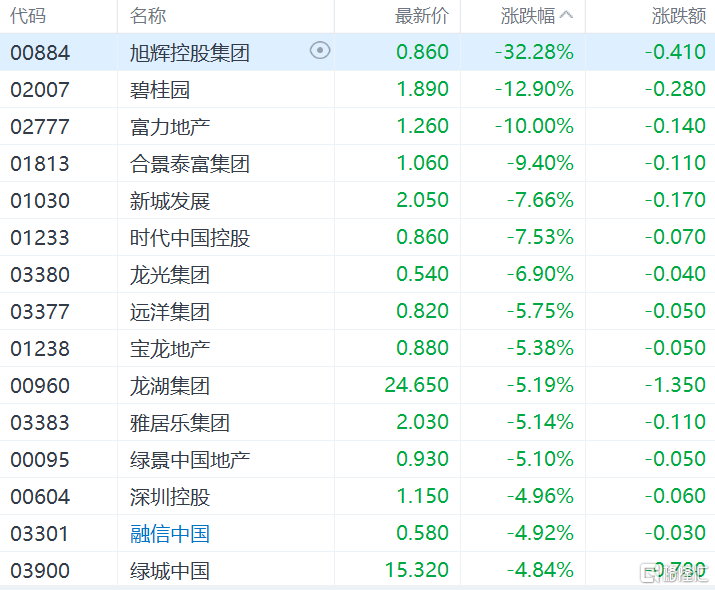
美元指數繼續走強,突破114再創逾20年新高,內房股受壓集體下挫。旭輝控股跌超32%,碧桂園跌12.9%,富力地產跌10%,新城發展、時代中國控股跌超7%,龍光集團跌6.9%,寶龍地產、龍湖集團等跌超5%。
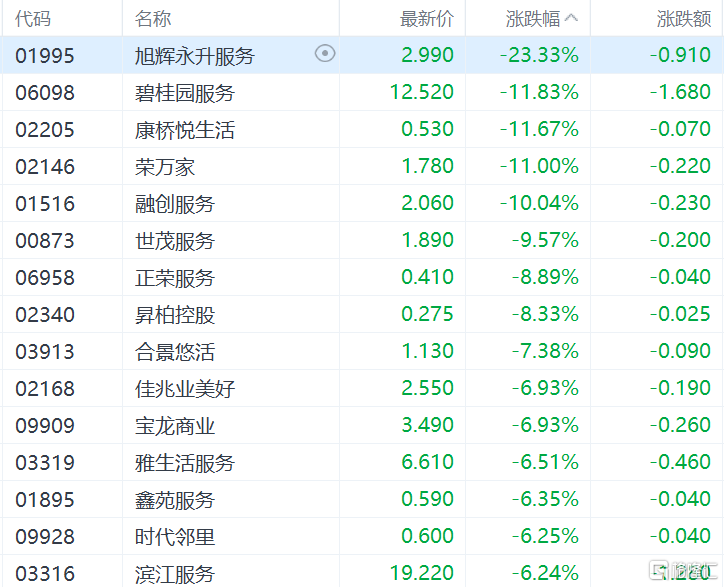
物管股跟隨走低,旭輝永升服務跌超23%,碧桂園服務、康橋悦生活跌超11%,融創服務跌10%,世茂服務跌9.57%,正榮服務、合景悠活、佳兆業美好等紛紛下跌。
有色金屬股齊跌,中國宏橋跌8.28%,中國白銀集團、中國鋁業、紫金礦業、中國黃金國際跌超6%,贛鋒鋰業跌5.67%,南方錳業、招金礦業、洛陽鉬業跌超4%。

分析人士認為,在美國通脹飆升、美聯儲加速加息、美元持續走強,金屬期貨開啟下行模式。
太陽能光伏股表現低迷,協鑫新能源跌超10%,信義能源跌9.13%,福萊特玻璃跌8.56%,山高新能源、洛陽玻璃股份、北京能源國際跌超7%。
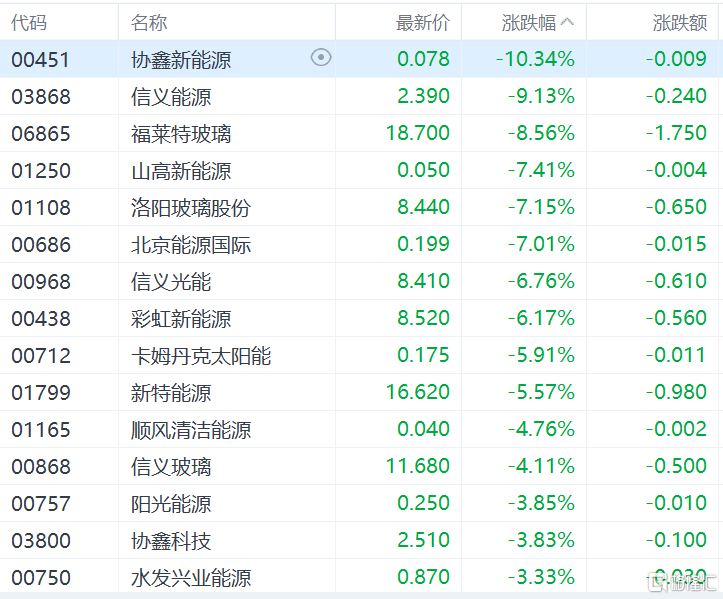
近一週,光伏玻璃繼續擴產,供應呈現持續增加趨勢。截至9月23日,光伏玻璃生產線共計347條,日熔量合計66960噸,環比增加2.53%,同比增加59.96%。天風證券點評指,考慮到今明兩年光伏玻璃擬投產新產能量較大,光伏玻璃未來形成供大於求的局面可能性較大。
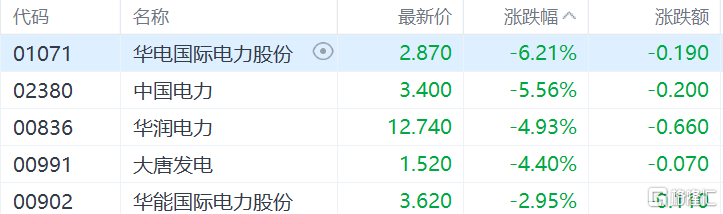
電力板塊全線下挫,華電國際電力股份跌6.21%,中國電力跌5.56%,華潤電力跌4.93%,大唐發電跌4.4%,華能國際電力股份跌2.95%。
個股方面:
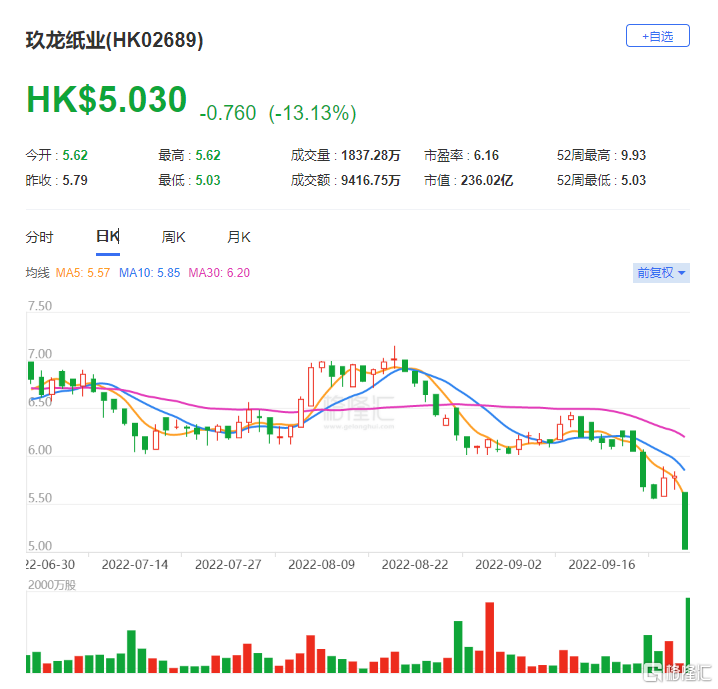
玖龍紙業跌超13%,報5.03港元。公司昨日盤後公吿,截至2022年6月30日止年度,公司收入增加約4.8%至人民幣645.38億元。毛利潤減少約40.2%至人民幣69.92億元。年內公司權益持有人應占盈利約為人民幣32.75億元,減少53.9%。
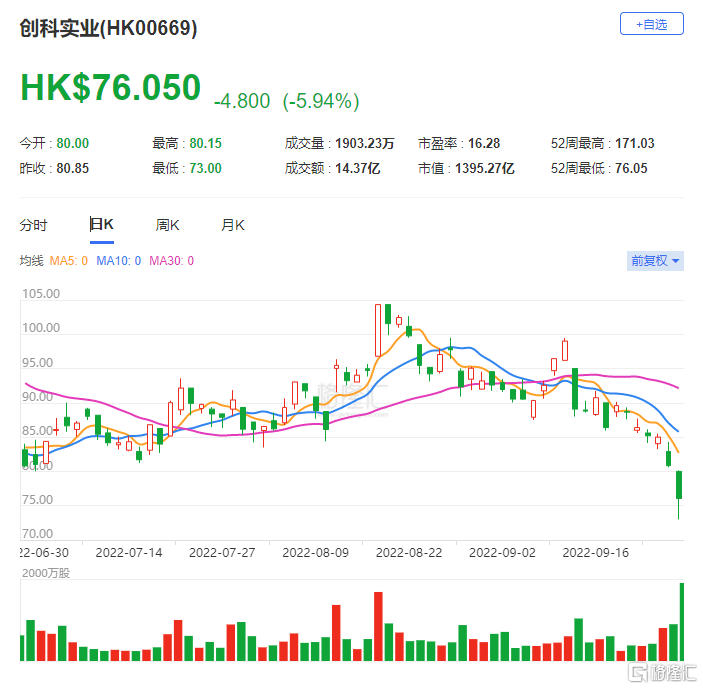
創科實業跌近6%,報76.05港元,目前總市值不足1400億港元。美元指數繼續走強,最高漲至114.70,續創逾20年新高。公司業務是覆蓋全球的,每個地區市場使用不同的貨幣交易,結算成美元可能會存在匯率損失。有分析稱,目前該公司面臨的最大風險是國際衝突以及匯率波動風險。
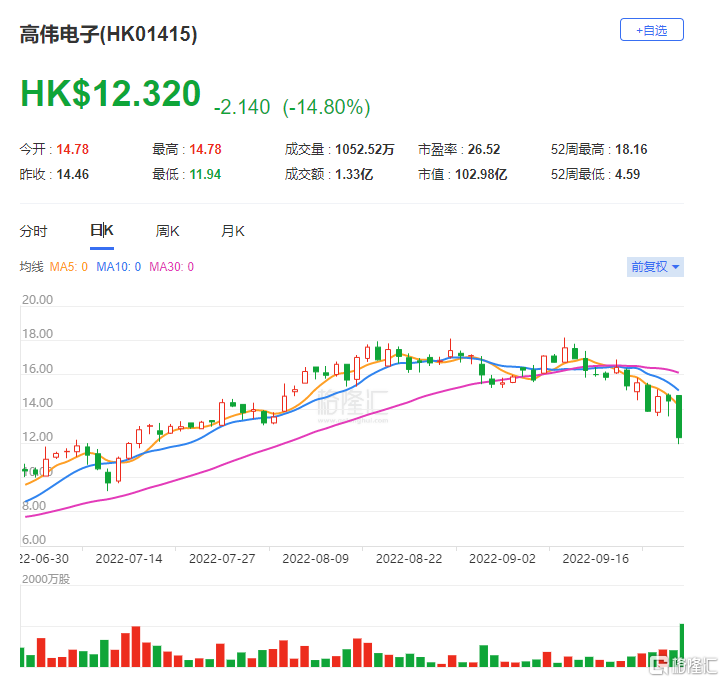
高偉電子跌14.8%,報12.32港元。消息面上,由於需求下滑,蘋果放棄了iPhone的增產計劃。
南下資金淨流入65.77億港元,其中港股通(滬)淨流入30.64億港元,港股通(深)淨流入35.13億港元。
展望後市,中金指出,上週受外圍市場環境影響,海外中資股繼續大幅下探。代表港股成長板塊的恆生科技指數領跌,達到7%。下週將迎來國慶長假,預計假期前市場交投或將持續清淡,投資者可能降低風險敞口等待更為清晰的政策信號,因此短期內市場可能處於持續盤整中。建議關注海外和國內政策潛在轉變,政策轉向有望成為推動市場反彈的催化劑。
Follow us
Find us on
Facebook,
Twitter ,
Instagram, and
YouTube or frequent updates on all things investing.Have a financial topic you would like to discuss? Head over to the
uSMART Community to share your thoughts and insights about the market! Click the picture below to download and explore uSMART app!

Disclaimers
uSmart Securities Limited (“uSmart”) is based on its internal research and public third party information in preparation of this article. Although uSmart uses its best endeavours to ensure the content of this article is accurate, uSmart does not guarantee the accuracy, timeliness or completeness of the information of this article and is not responsible for any views/opinions/comments in this article. Opinions, forecasts and estimations reflect uSmart’s assessment as of the date of this article and are subject to change. uSmart has no obligation to notify you or anyone of any such changes. You must make independent analysis and judgment on any matters involved in this article. uSmart and any directors, officers, employees or agents of uSmart will not be liable for any loss or damage suffered by any person in reliance on any representation or omission in the content of this article. The content of the article is for reference only and does not constitute any offer, solicitation, recommendation, opinion or guarantee of any securities, virtual assets, financial products or instruments. Regulatory authorities may restrict the trading of virtual asset-related ETFs to only investors who meet specified requirements. Any calculations or images in the article are for illustrative purposes only.
Investment involves risks and the value and income from securities may rise or fall. Past performance is not indicative of future performance. Please carefully consider your personal risk tolerance, and consult independent professional advice if necessary.


