業績一出連續大漲,東阿阿膠能飛多高?
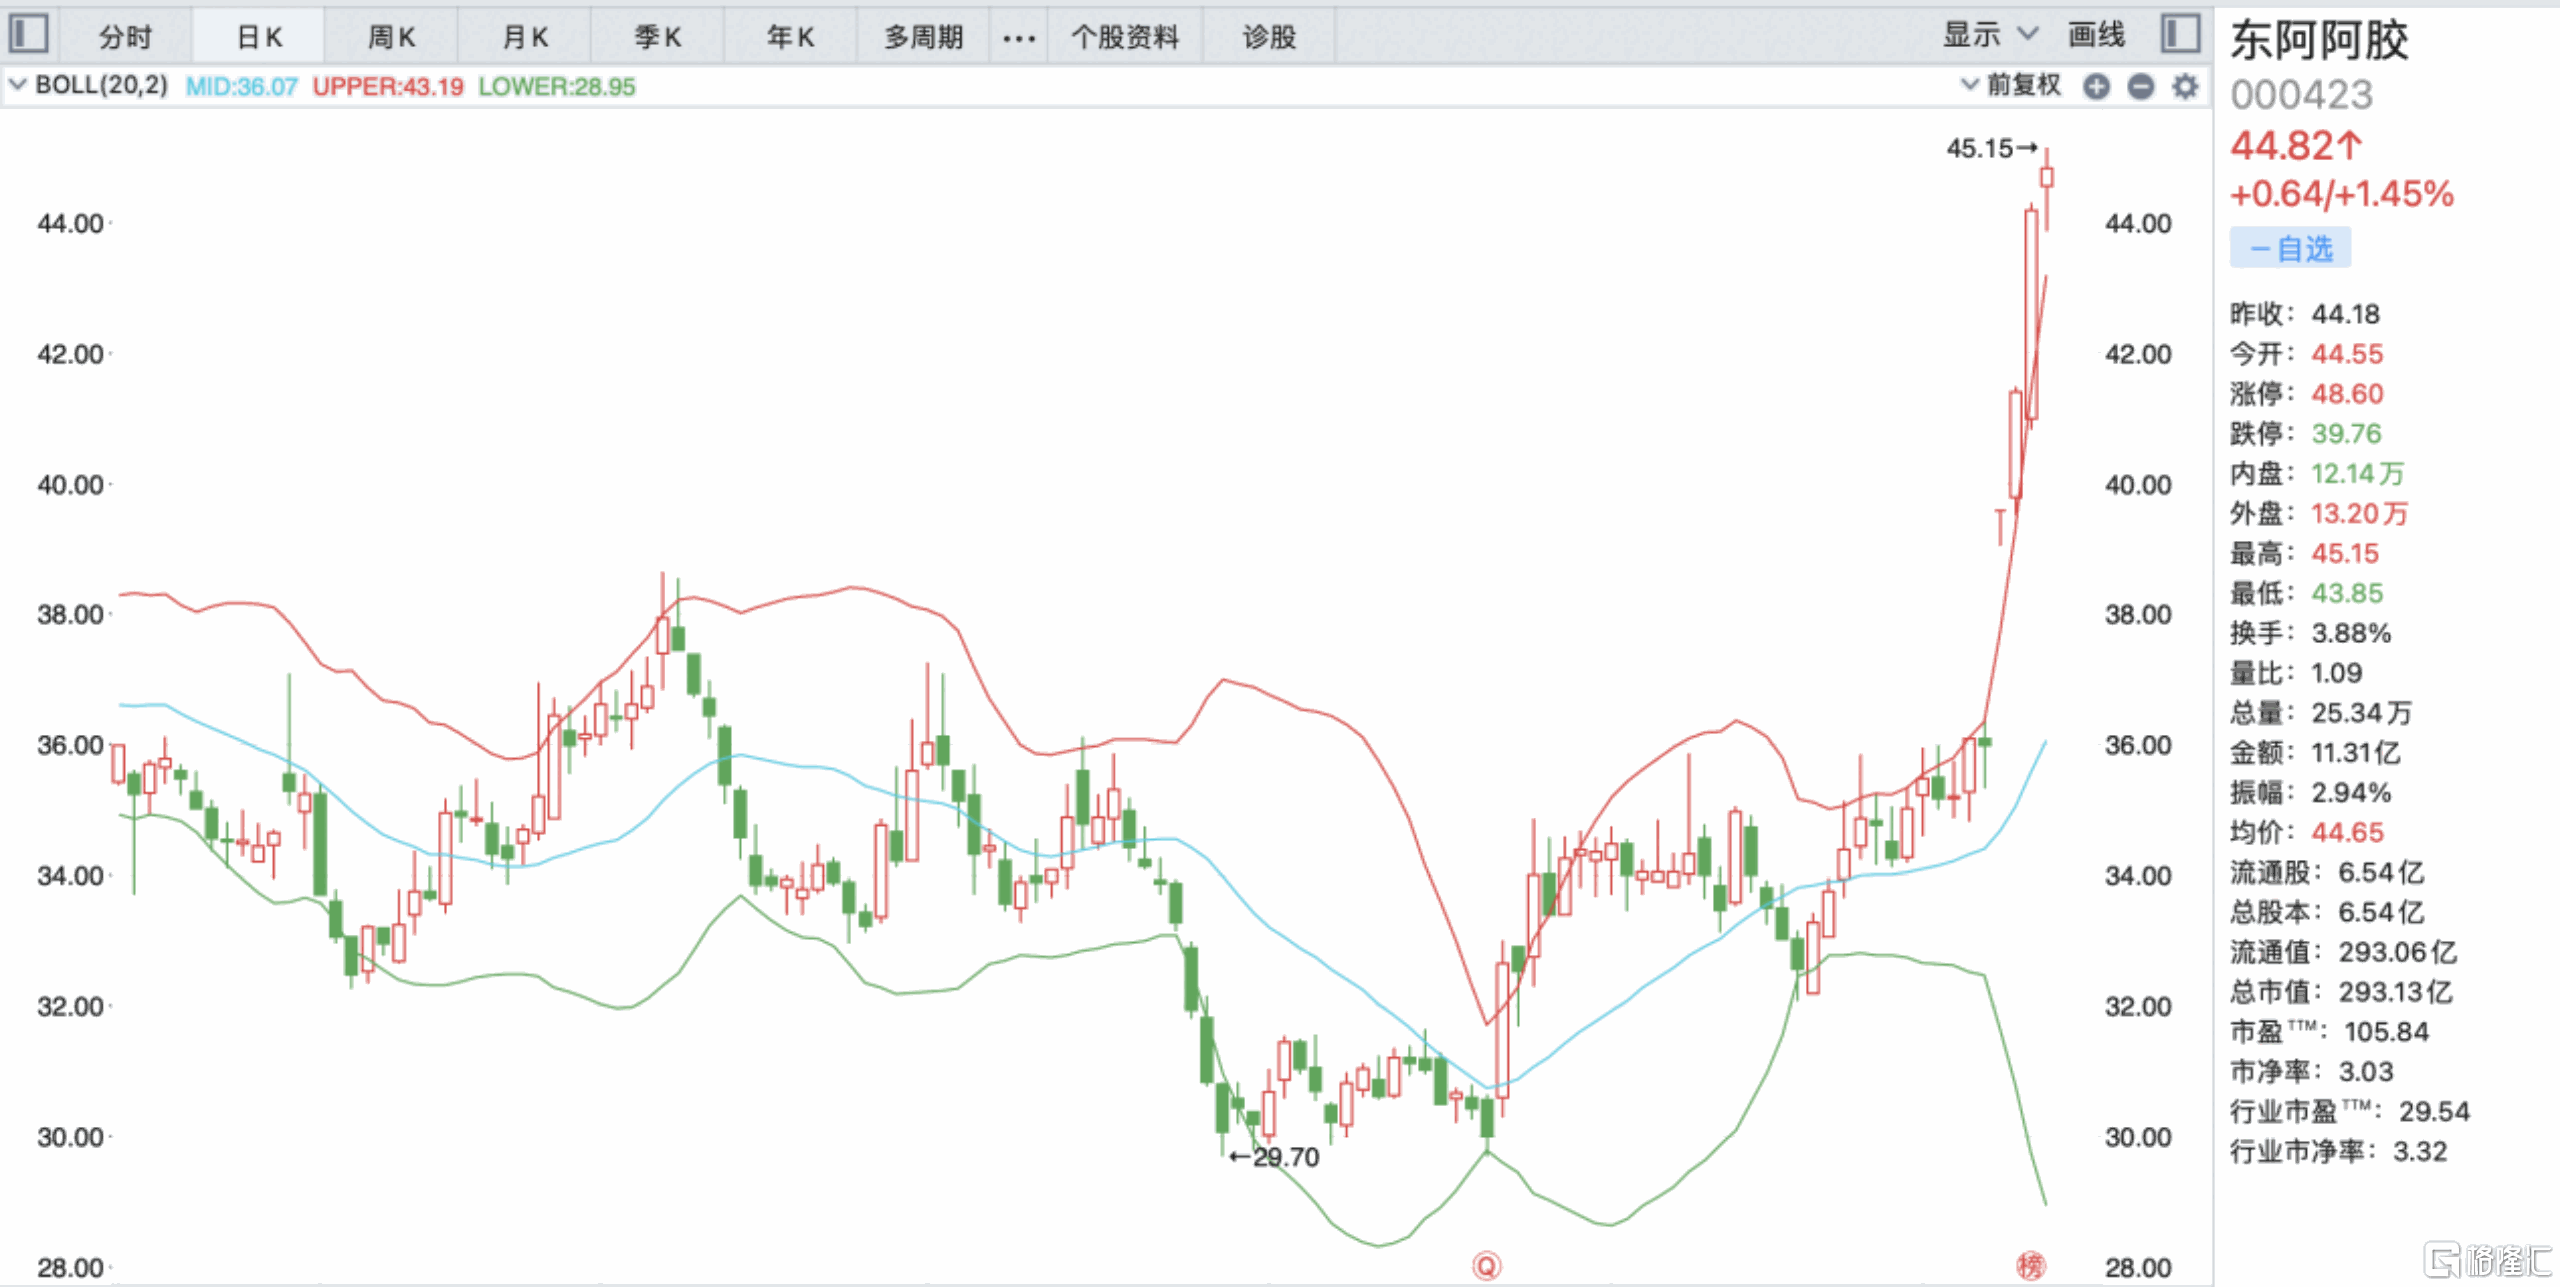
從18年開始東阿阿膠股價一路下跌,從最高的70元,跌到最低25元,東阿阿膠股民苦不堪言。然而最近幾天東阿阿膠連續大漲,4天累計漲幅超25%,市值即將突破300億關口,由此吸引了越來越多投資者的關注。
東阿阿膠股價的突然大漲,是公司基本面發生了變化,還是單純的炒作?
01
三季報超預期,機構認可度提升
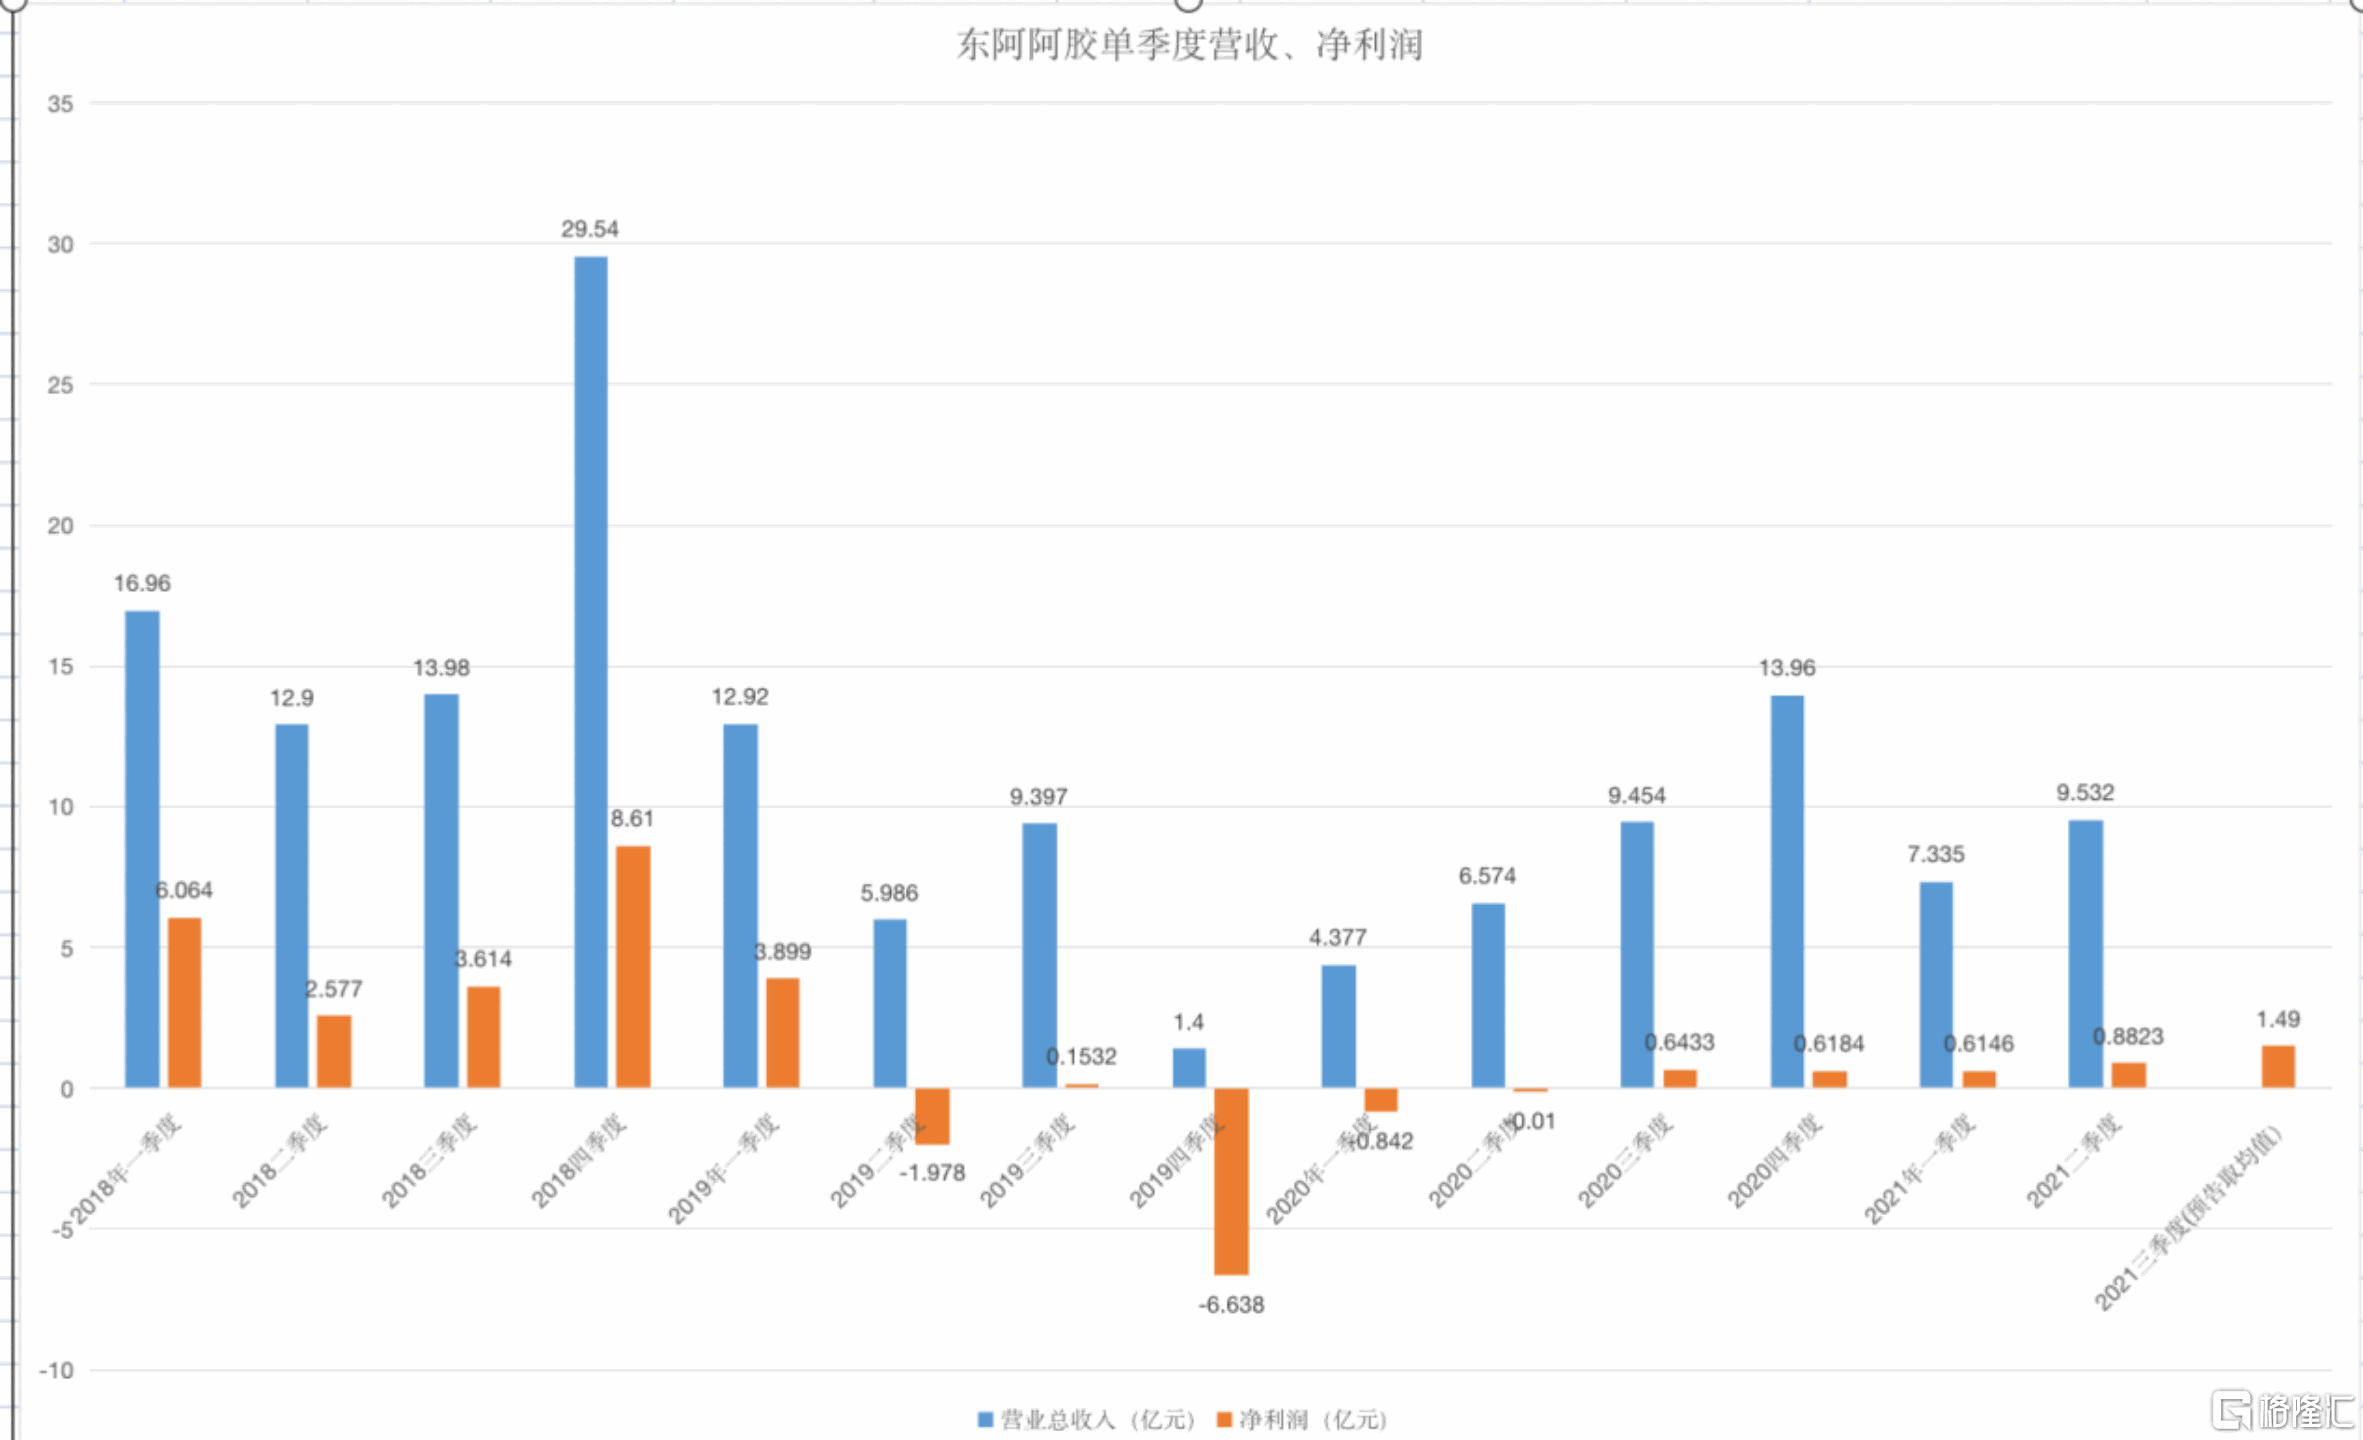
近日,公司公佈前三季度業績預吿。前三季度,公司歸母淨利潤預計達2.81億-3.16億,同比增長14.4倍-16.08倍。單三季度歸母淨利潤預計為1.31億至1.67億,同比增長109%-164%,遠超市場預期。
今年以來,公司歸母淨利潤分別為0.6、0.9、1.3-1.7億(公司業績預吿披露),逐季加速。同時結合Q1、Q4為阿膠銷售較旺的秋冬季,Q2、Q3為阿膠銷售較淡的春夏季;今年Q3淡季銷售好於Q1旺季,表明公司在Q3銷售提速明顯。
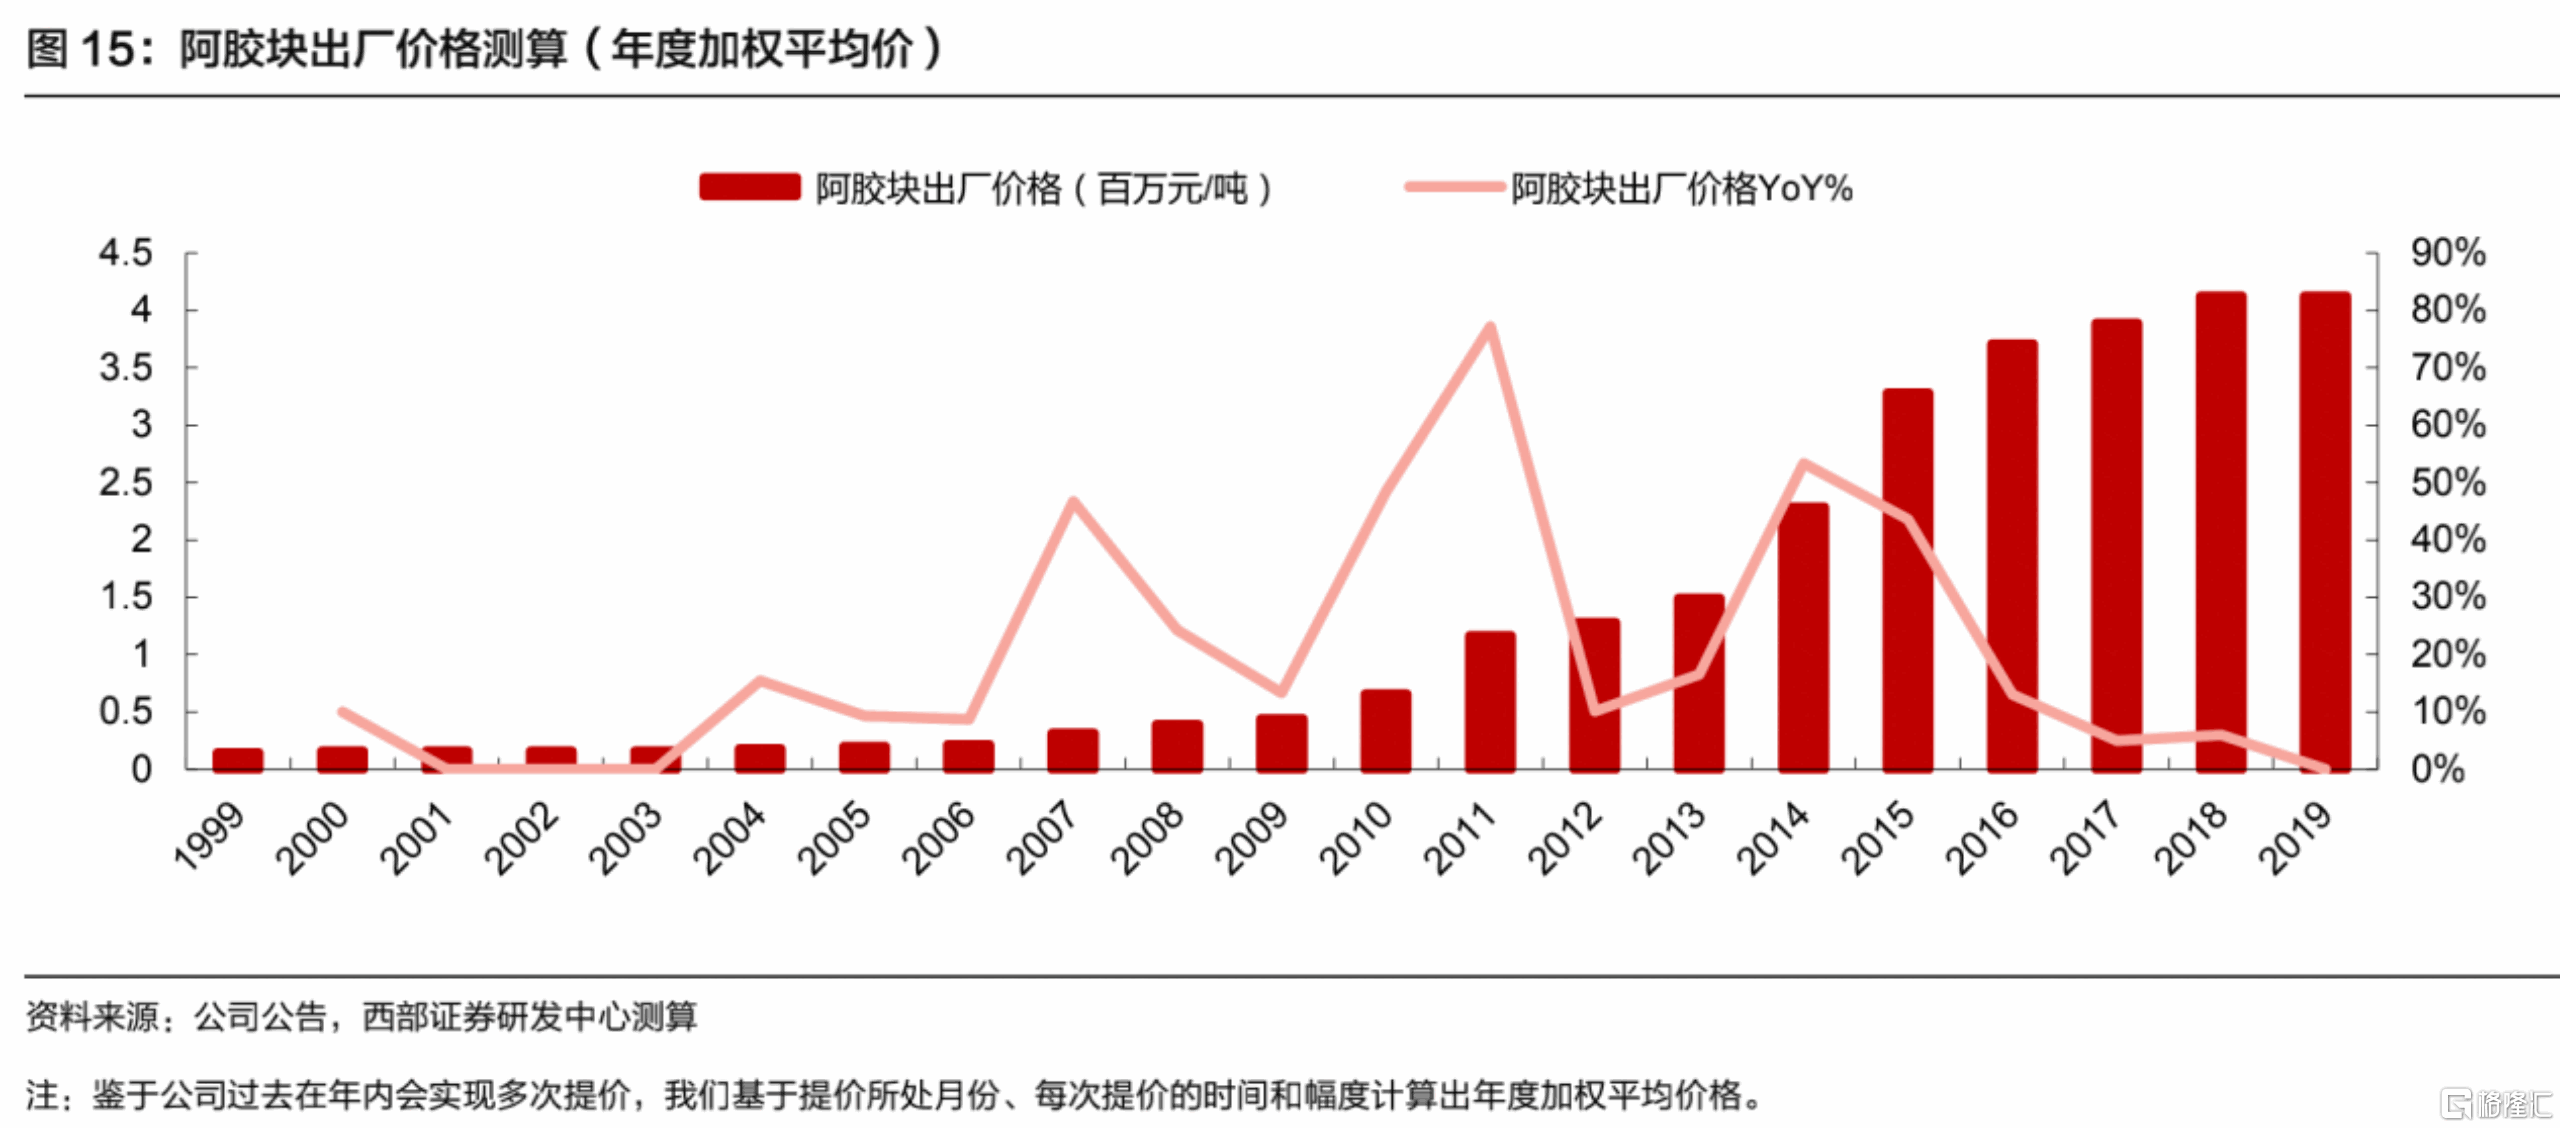
華創證券最新觀點認為,東阿阿膠基本面恢復良好,利潤端有望進入快速增長階段。目前,根據推算公司渠道庫存已恢復至良性水平(約3個月左右),終端零售價持續恢復(阿膠塊已恢復至900-1000元區間/250g,阿膠漿已恢復至300元以上/48只),公司結算模式由先貨後款逐步轉變為先款後貨,管理層基本調整完畢。
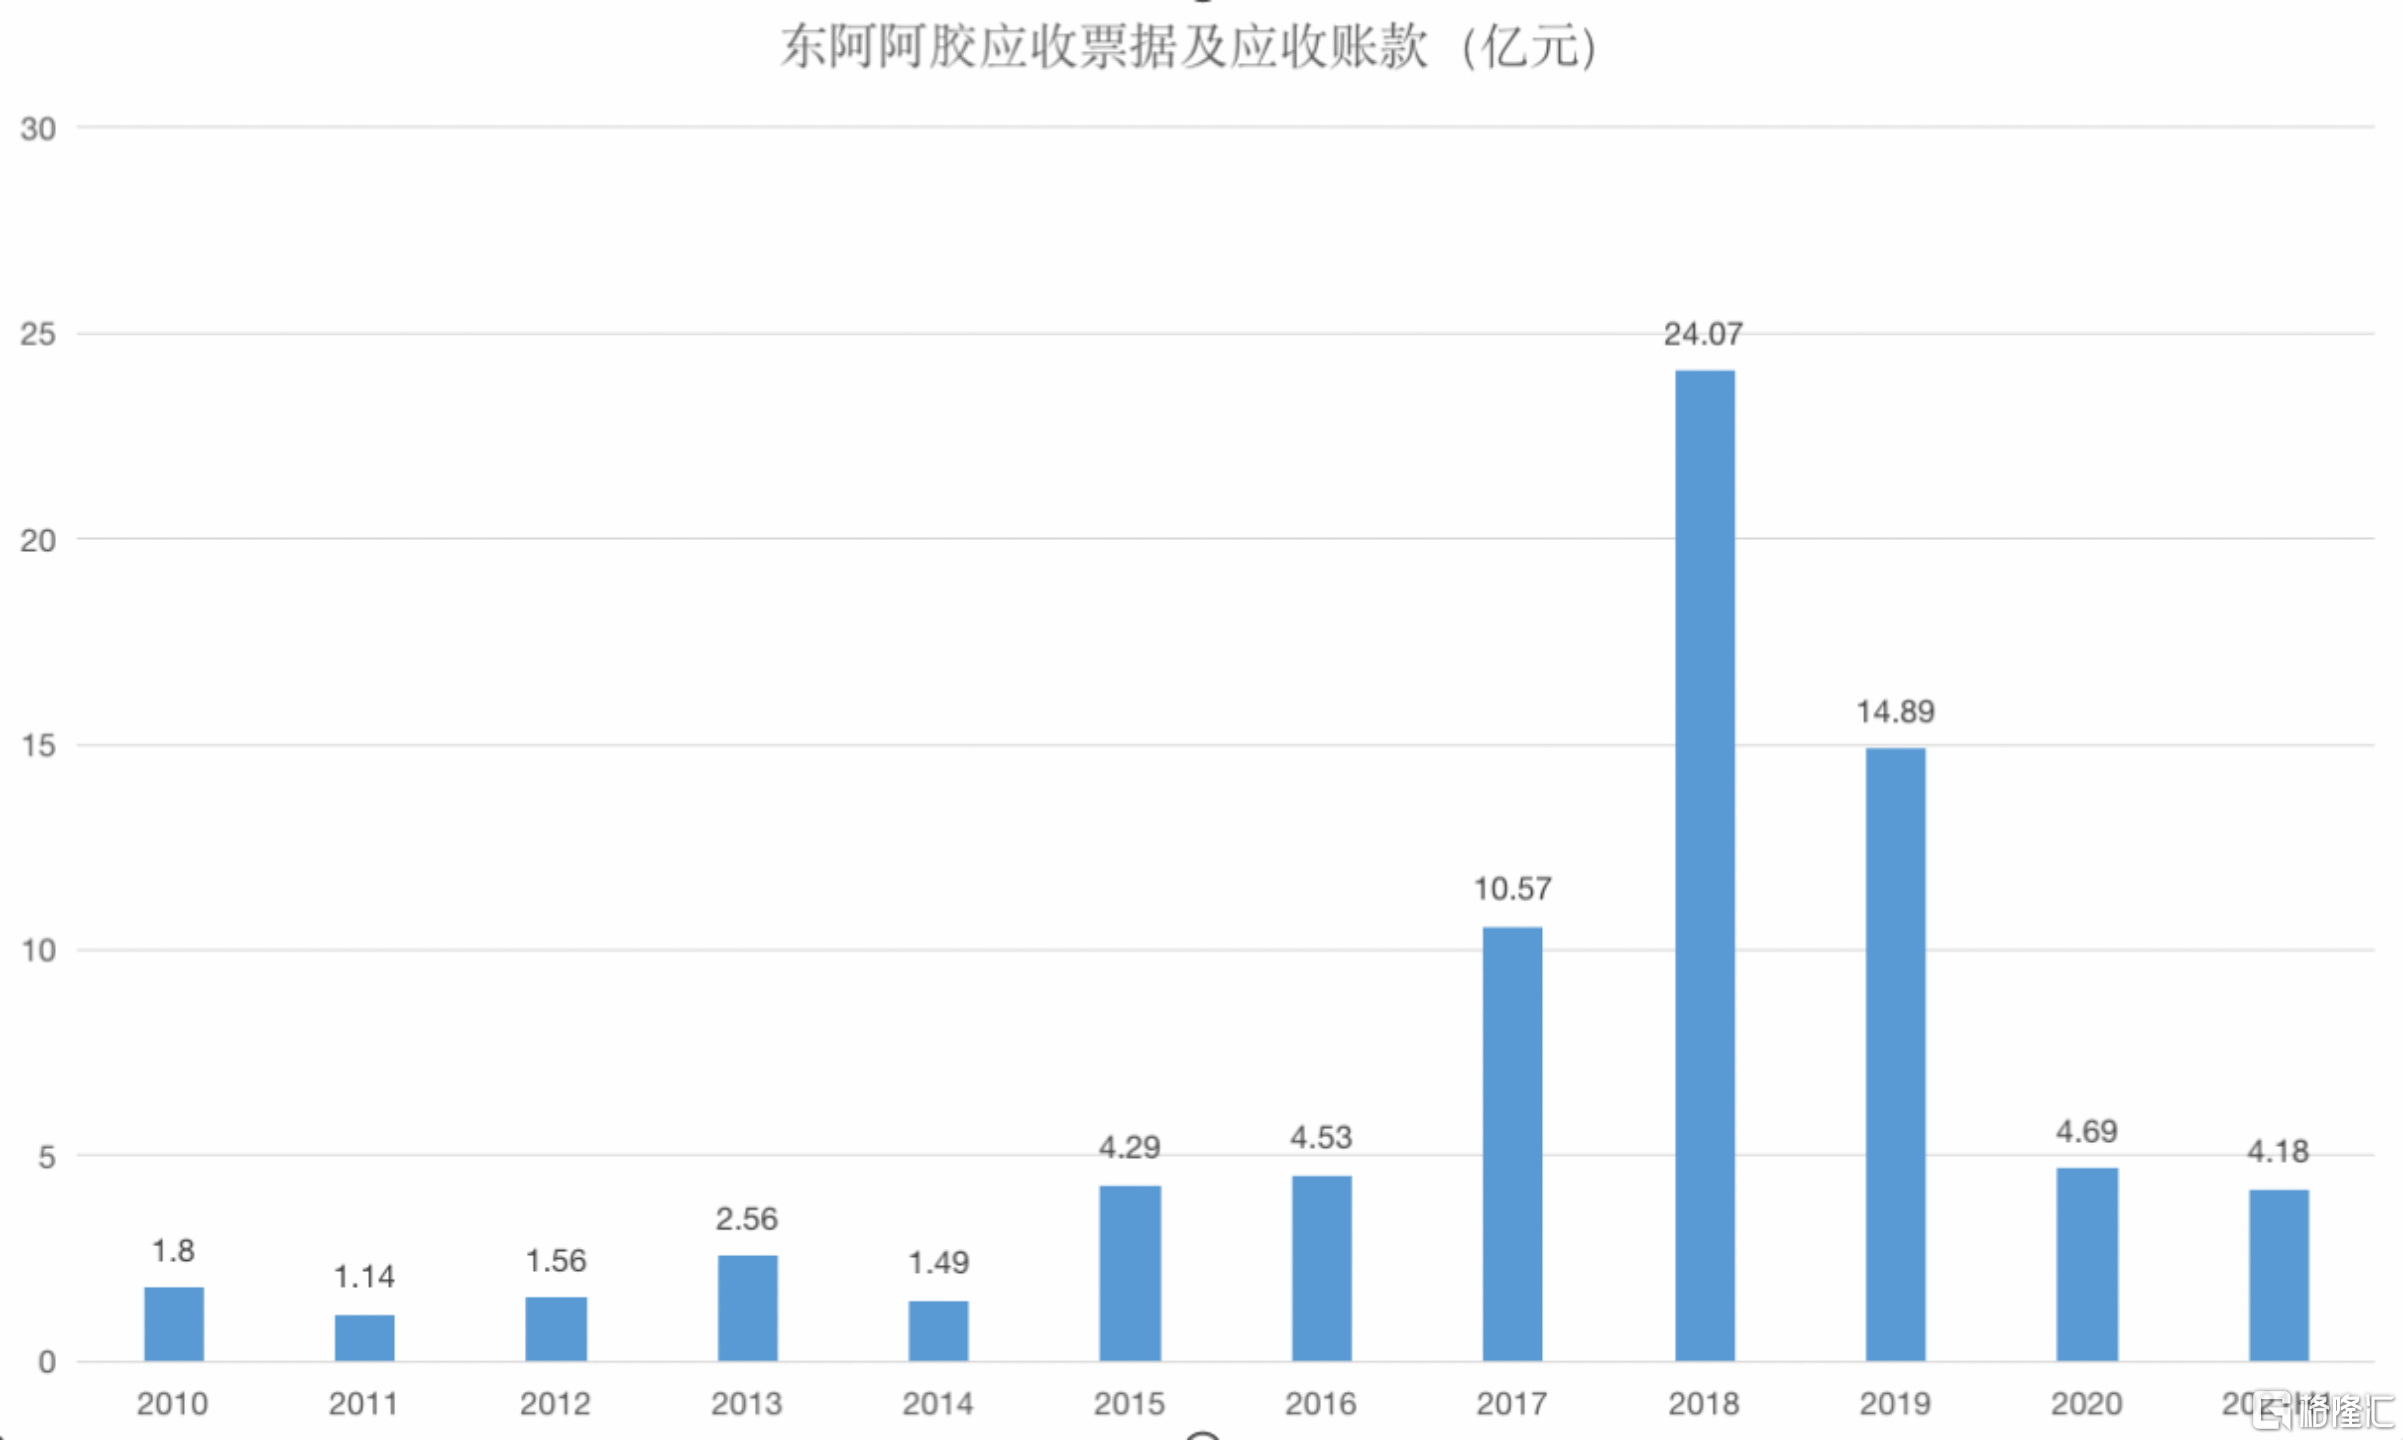
通過對東阿阿膠過去的覆盤,不難發現造成2019年東阿阿膠業績斷崖式下跌的主因是“渠道庫存”。如今兩年過去了,其渠道庫存已基本好轉。在與渠道庫存關係最為緊密的“應收款項”方面,財報顯示,2020年及2021年上半年,公司應收賬款水平已經回到了2016年的水平。
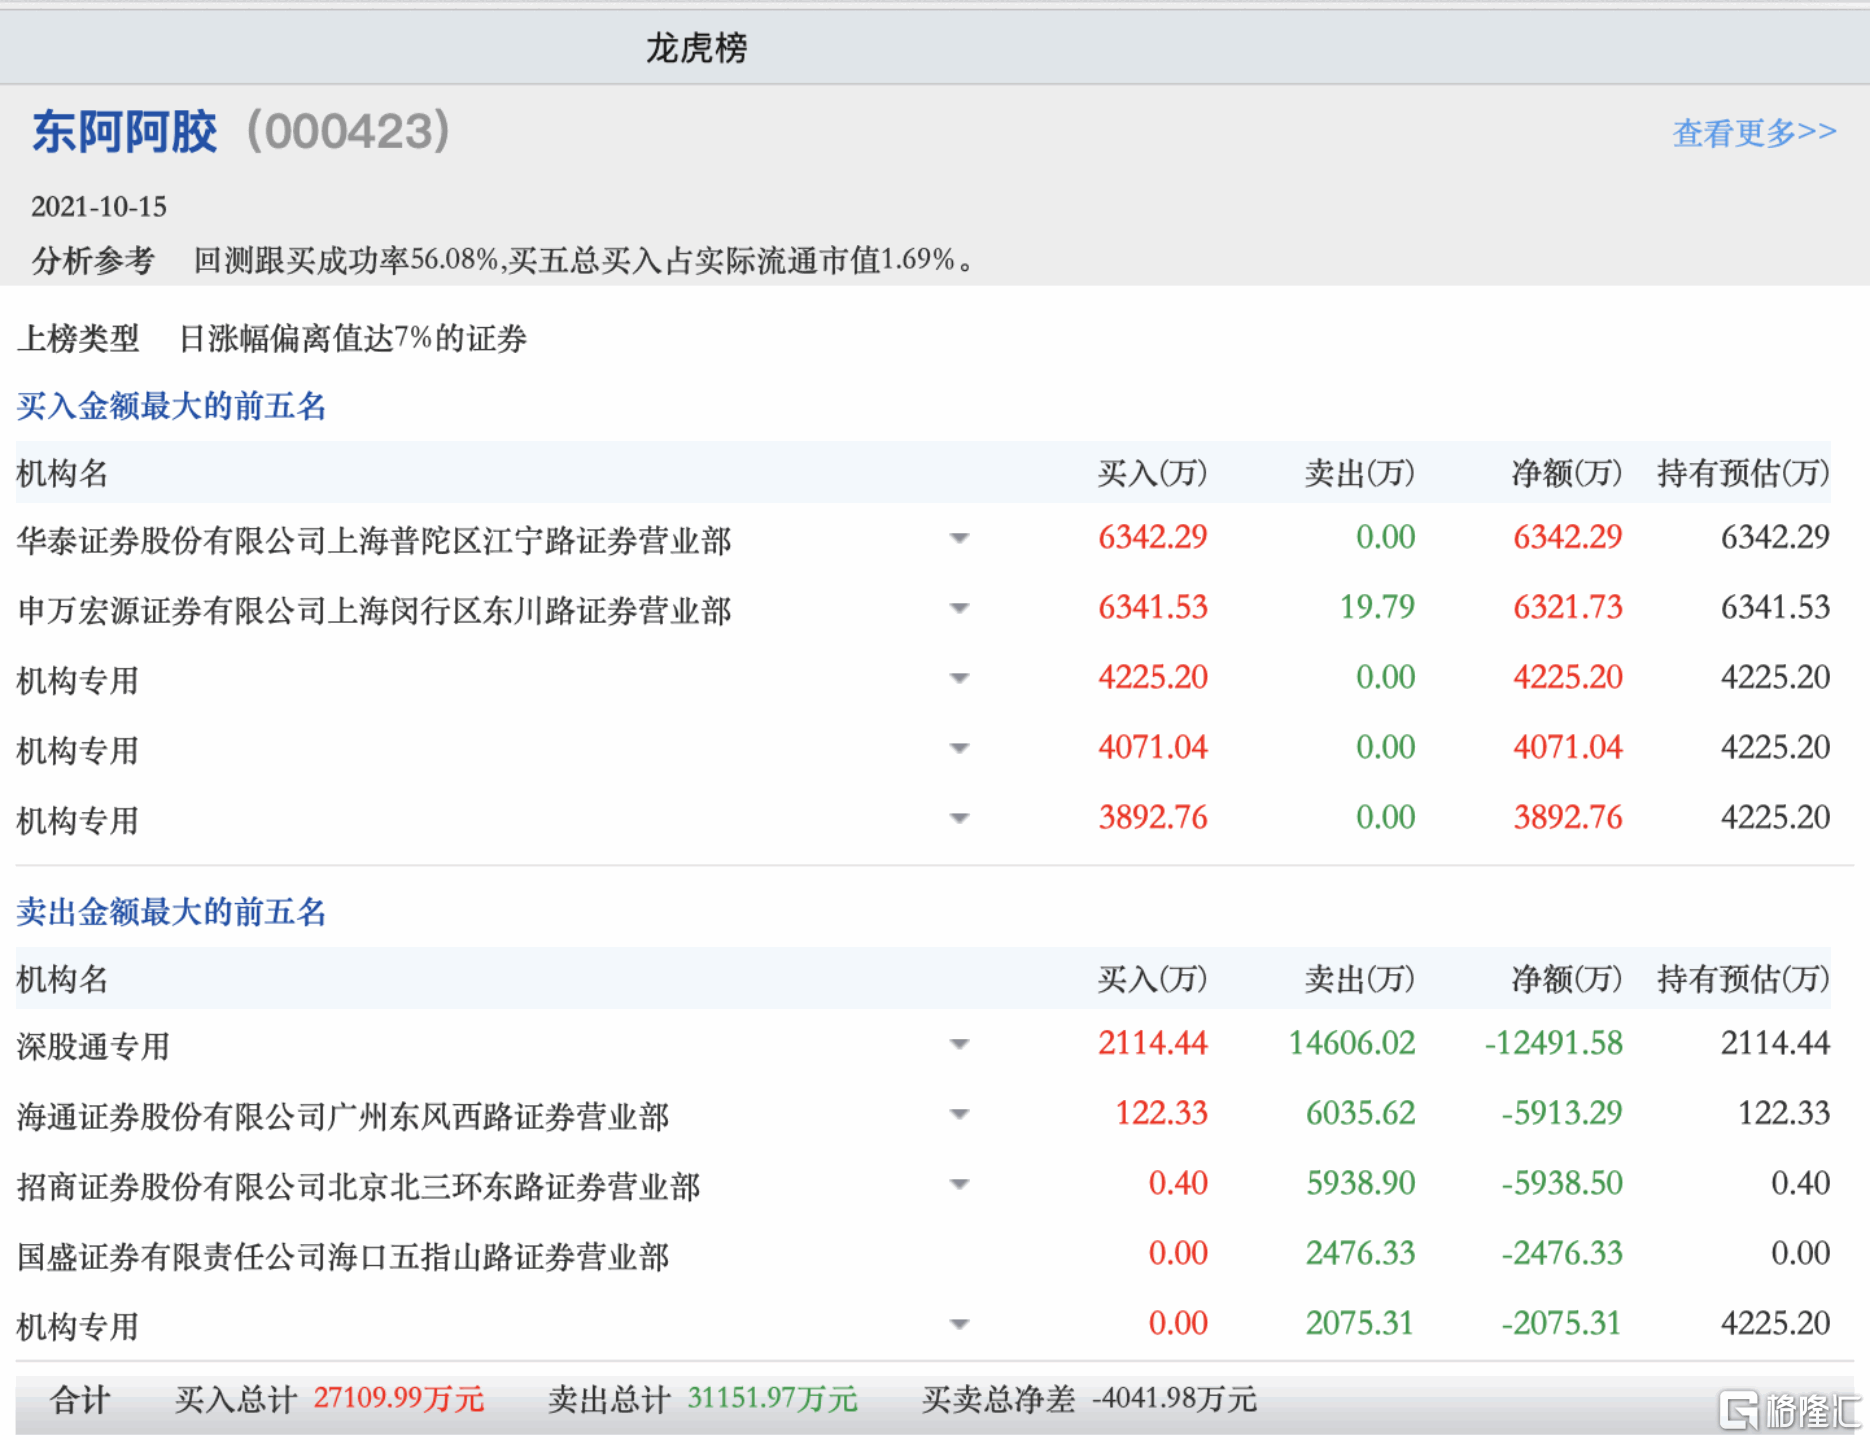
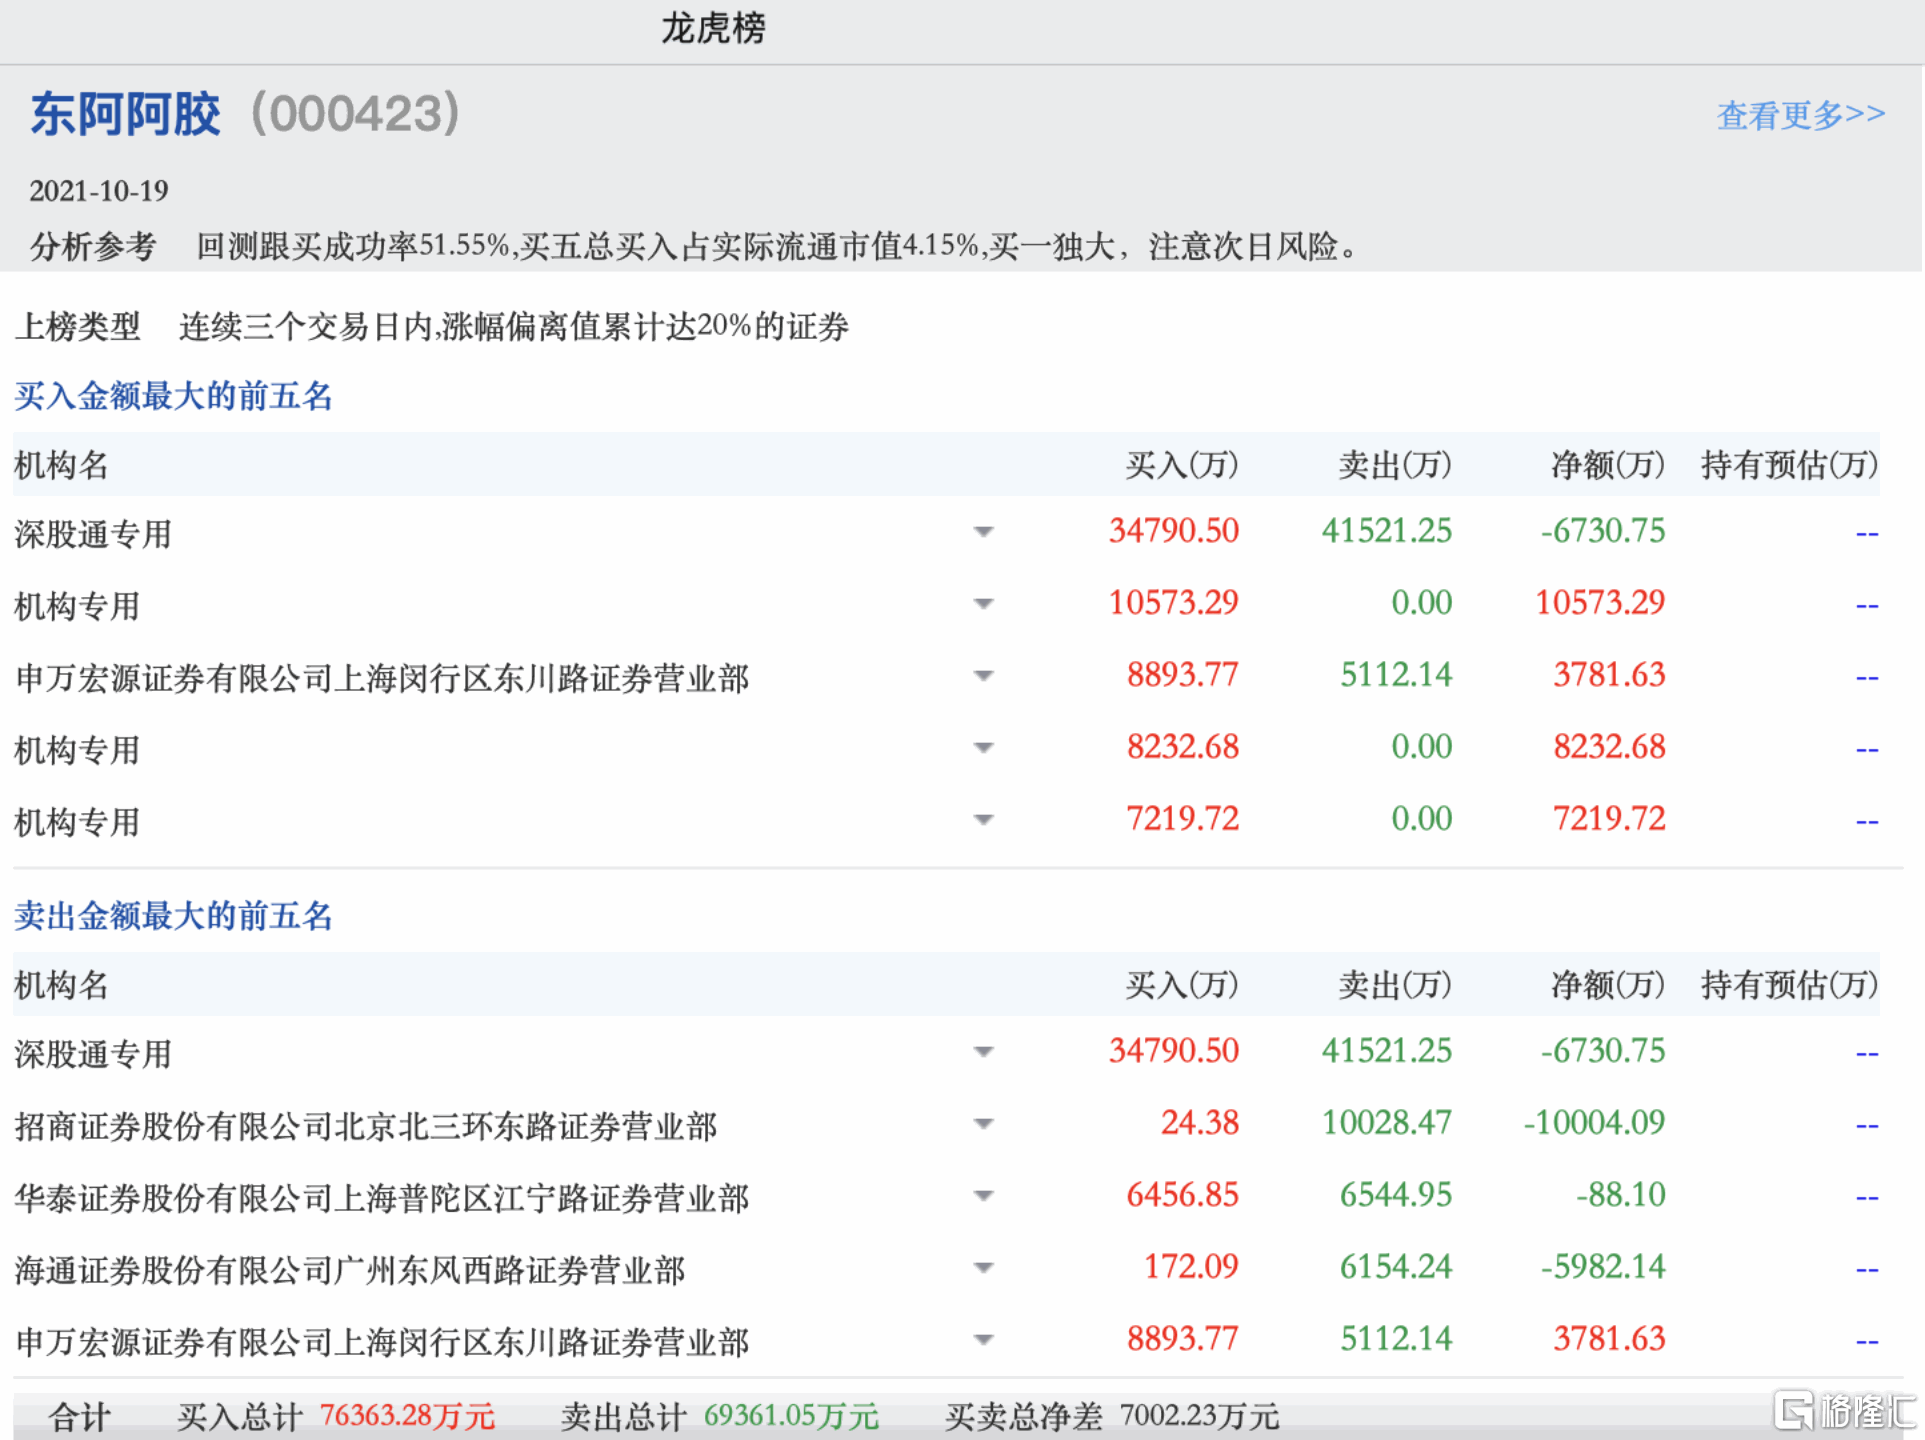
同時結合15日和19日的龍虎榜,可以明顯看到東阿阿膠最近幾天連續大漲,主導因素在於機構持續買入,而非遊資主導的炒作行情。
02
東阿阿膠的未來
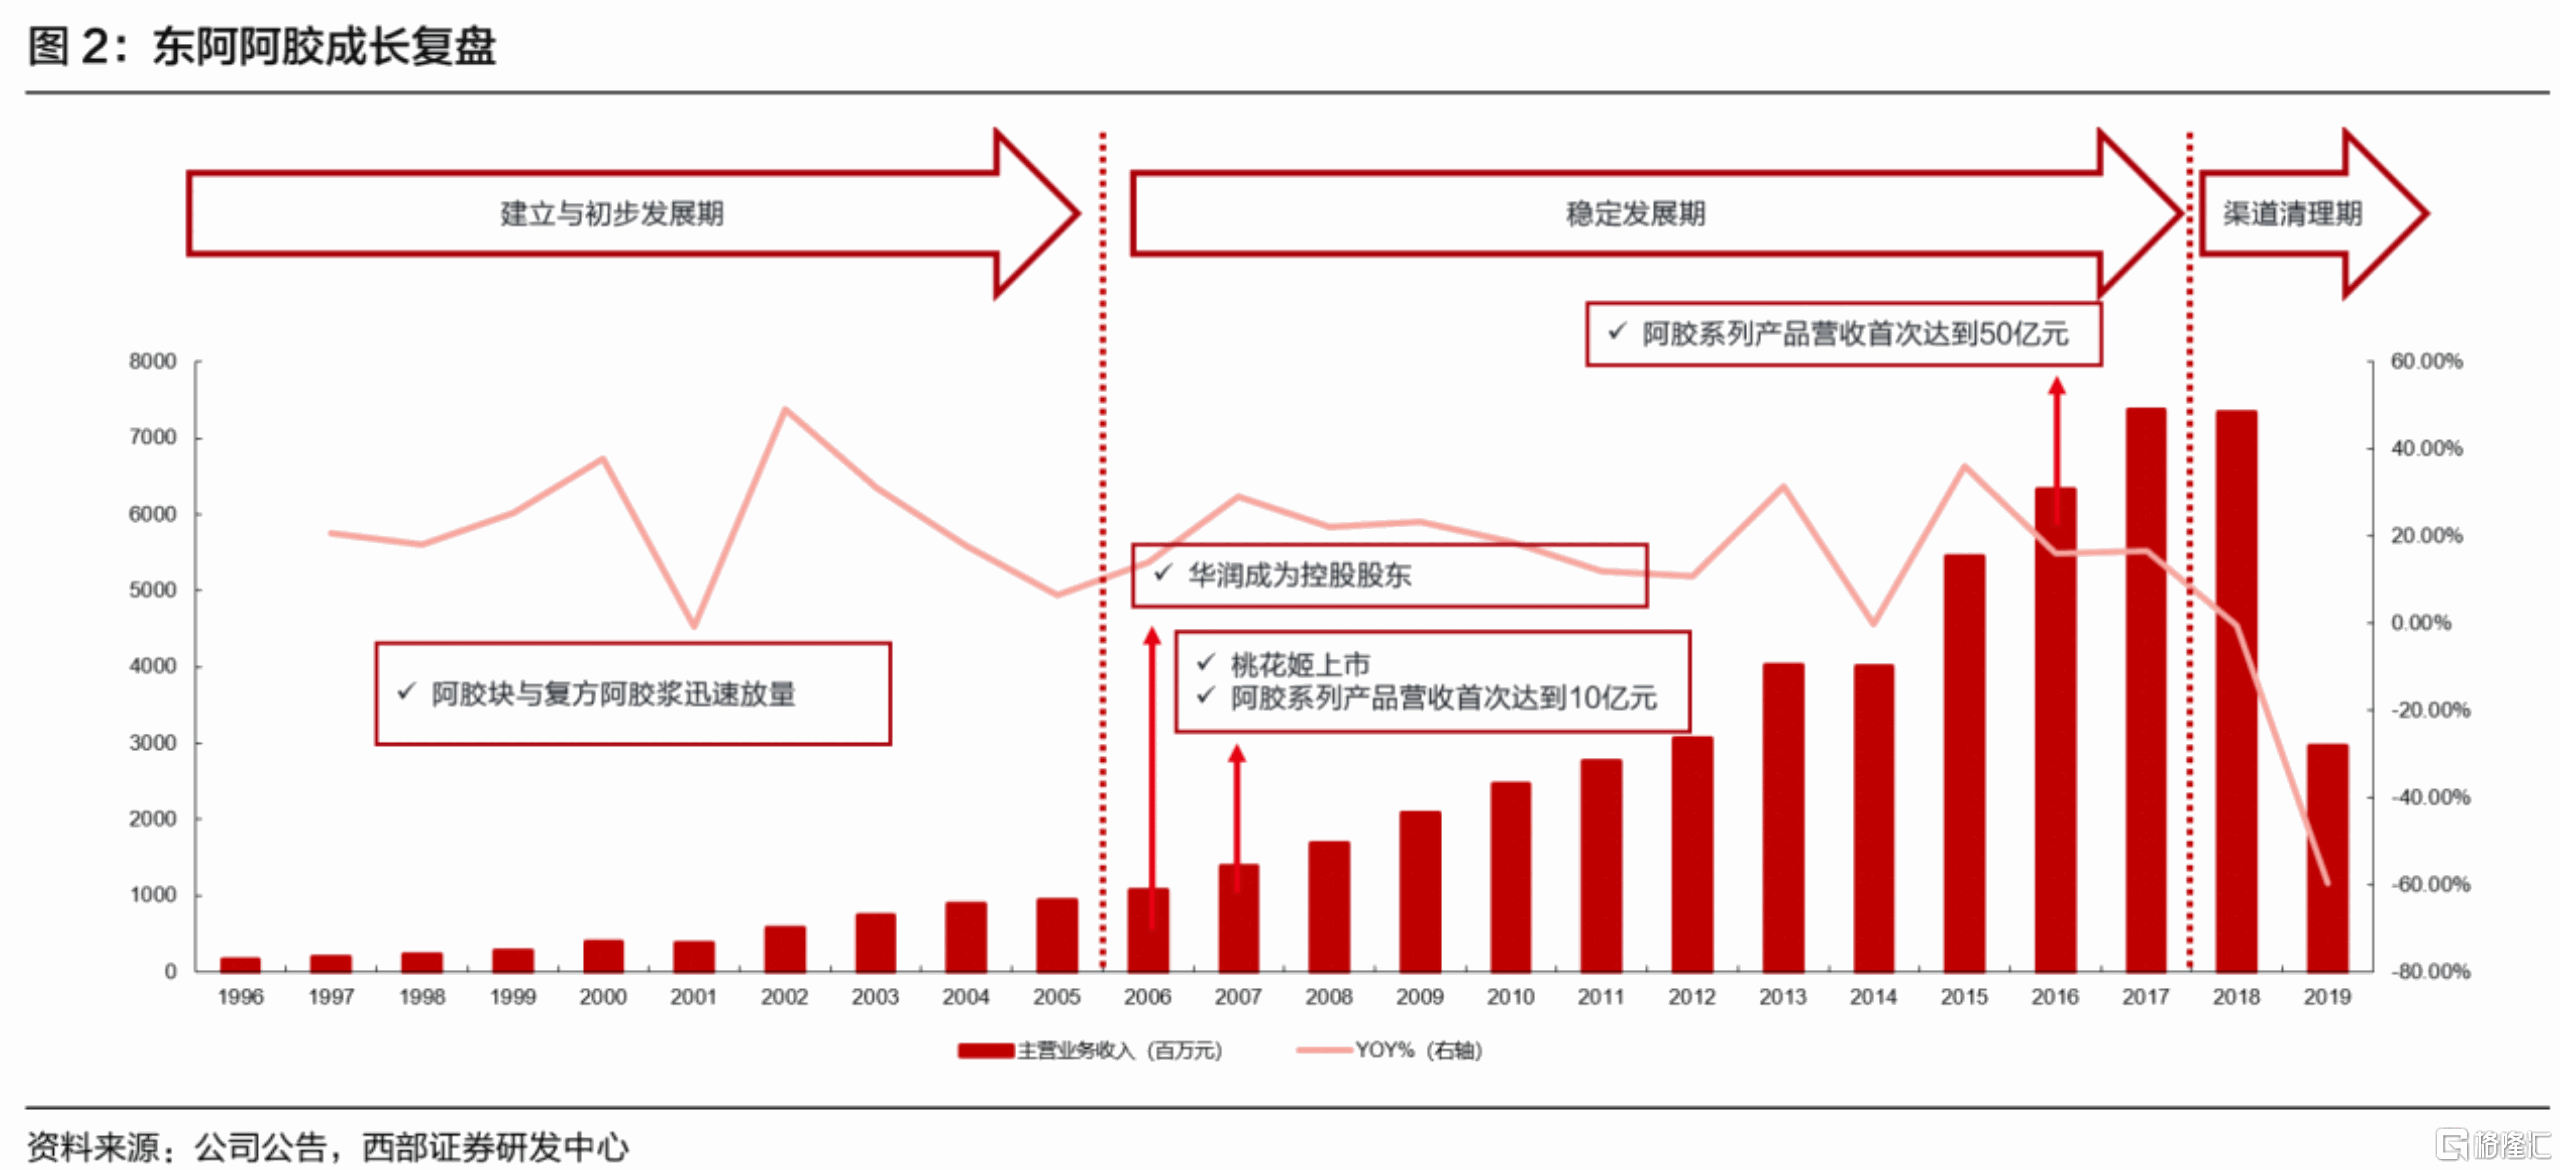
東阿阿膠是中國最大的阿膠生產企業,品種力與品牌力均排名中藥行業前列,同時也是阿膠行業標準的制定者。
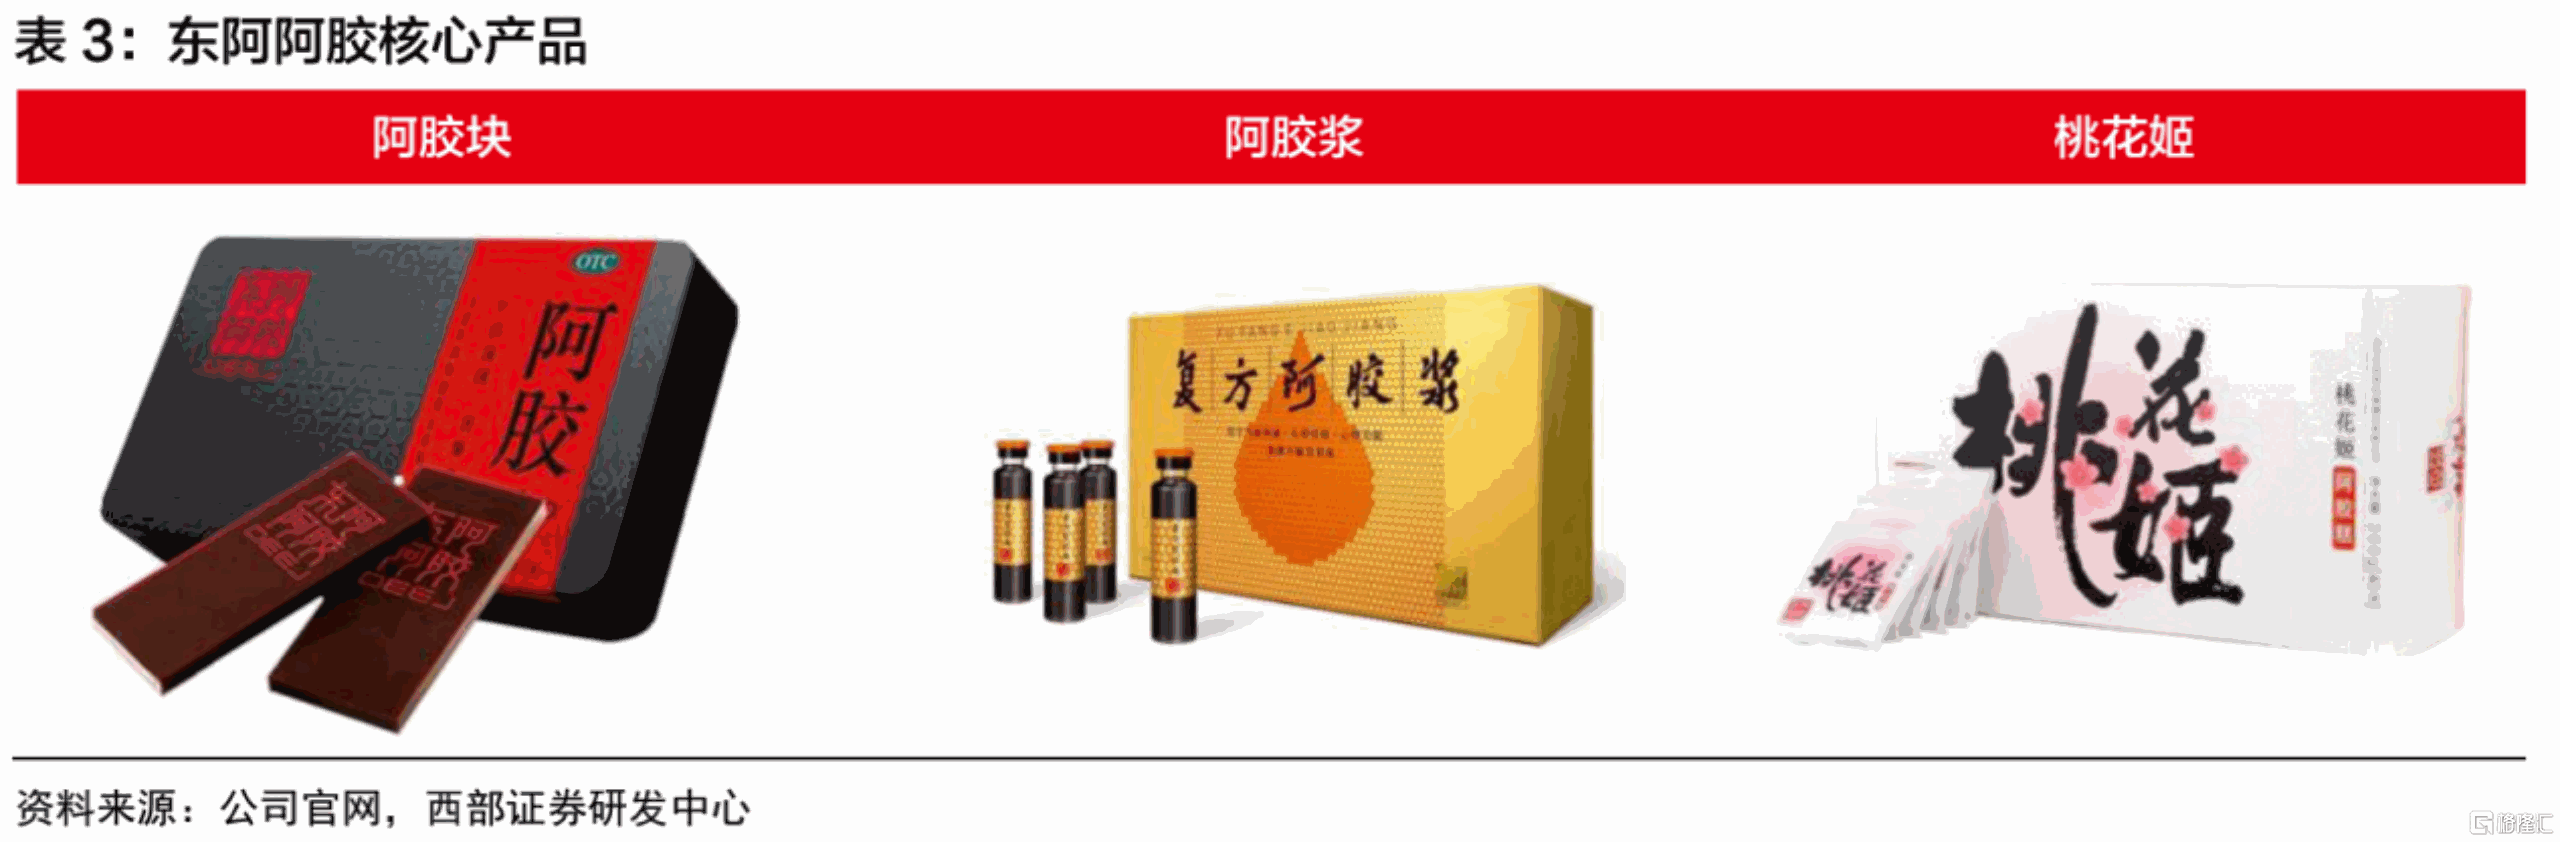
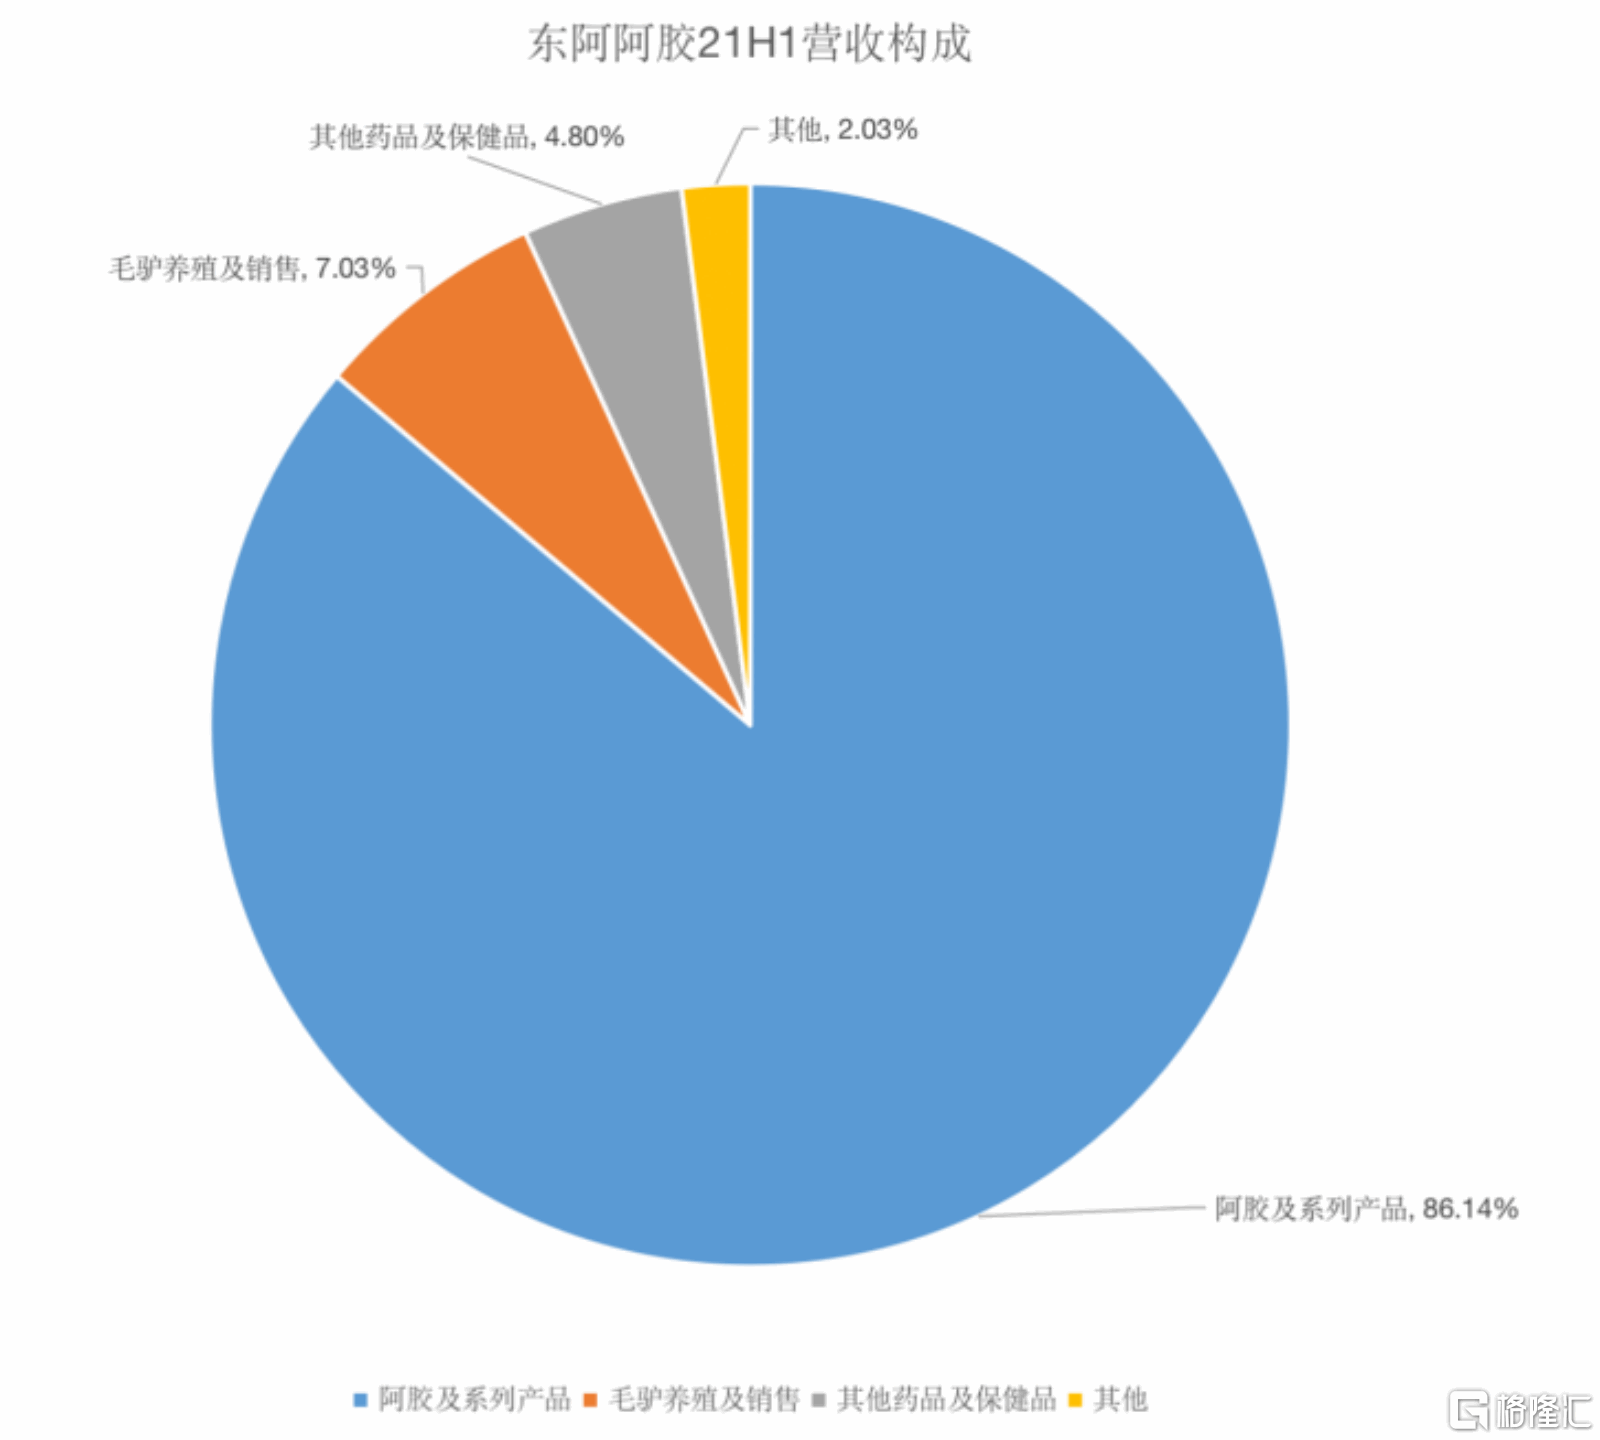
在公司21H1營收中,阿膠及系列產品佔比達到86.14%。阿膠系列產品包括阿膠塊,阿膠漿、桃花姬等。根據公司的十四五規劃,“阿膠塊:阿膠漿:保健品”未來保持4:2:2的營收比例,但目前阿膠塊當前仍是東阿阿膠最核心的產品。
阿膠塊作為東阿阿膠最核心的產品,在線下藥店渠道已鋪貨多年,經過20多年的連續提價,仍依靠較強的品種力與品牌力,積攢了以高淨值人羣為主的60萬以上穩定消費者羣體。但與此同時,阿膠塊較高的價格、線下固定的藥店渠道以及較複雜的食用方法將眾多年輕消費者擋在門外,銷量難以提升,市場空間有限。
過去,公司經銷商基於往期“提價預期,大量囤貨,同時賺取囤貨套利與產品差價兩層利潤”的經營邏輯,大量買走阿東阿膠的產品。但這一邏輯在2018年碰到困難,2019年出現崩塌。在今年的投資者交流會上管理層也表示今後會慎重提價。
對於阿膠大單品能否為未來的業績支撐提供保證?公司的業績增長點在哪裏?
公司管理層在上半年業績交流會中指出:隨着公司業務及產品不斷拓展延伸,將會分擔阿膠塊對業績收入的貢獻力,同時新產品的培育和成長是需要一定時間和空間的。未來,公司將以阿膠作為基石產品,結合大健康行業發展趨勢與消費者需求,尋找更多市場機會,向更多功能性產品方向發展,如內服美容、快消功能食品、跨界合作等,實現從存量市場到增量市場的轉變。
根據華創證券最新預測公司2021-2023年EPS分別為0.5/0.78/1.14元,公司未來自由現金流穩定,採用 DCF法估值,合理價格為51元左右,截止10月20日收盤東阿阿膠股價為44.8元,仍然具有一定上漲空間。
Follow us
Find us on
Facebook,
Twitter ,
Instagram, and
YouTube or frequent updates on all things investing.Have a financial topic you would like to discuss? Head over to the
uSMART Community to share your thoughts and insights about the market! Click the picture below to download and explore uSMART app!

Disclaimers
uSmart Securities Limited (“uSmart”) is based on its internal research and public third party information in preparation of this article. Although uSmart uses its best endeavours to ensure the content of this article is accurate, uSmart does not guarantee the accuracy, timeliness or completeness of the information of this article and is not responsible for any views/opinions/comments in this article. Opinions, forecasts and estimations reflect uSmart’s assessment as of the date of this article and are subject to change. uSmart has no obligation to notify you or anyone of any such changes. You must make independent analysis and judgment on any matters involved in this article. uSmart and any directors, officers, employees or agents of uSmart will not be liable for any loss or damage suffered by any person in reliance on any representation or omission in the content of this article. The content of the article is for reference only and does not constitute any offer, solicitation, recommendation, opinion or guarantee of any securities, virtual assets, financial products or instruments. Regulatory authorities may restrict the trading of virtual asset-related ETFs to only investors who meet specified requirements. Any calculations or images in the article are for illustrative purposes only.
Investment involves risks and the value and income from securities may rise or fall. Past performance is not indicative of future performance. Please carefully consider your personal risk tolerance, and consult independent professional advice if necessary.


