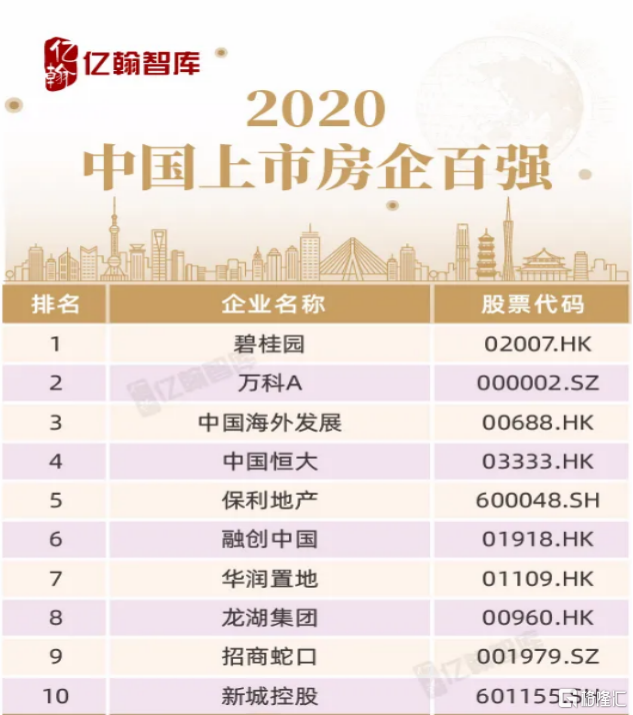
“2020中國上市房企百強”榜單來了!碧桂園連續三年位居第一
5月26日,億翰智庫發佈《2020中國上市房企百強研究報告》,其中,龍頭房企碧桂園(股份代號:2007.HK)營收利潤穩步增長、財務保持穩健,榮登“2020中國上市房企百強”TOP1。碧桂園已經連續第三年位居這一榜單的第一名。
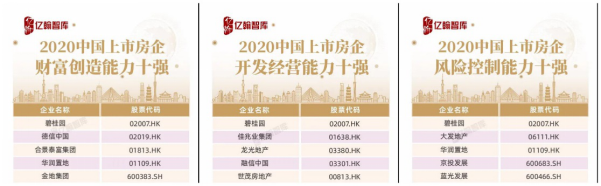
此外,碧桂園還榮獲“2020中國上市房企財富創造能力十強”“2020中國上市房企開發經營能力十強”“2020中國上市房企風險控制能力十強”三項榜單的第一名,併入選“2020高信用評級上市房企”前十強。
作為中國房地產行業頗具影響力的智庫機構,億翰智庫通過綜合考量上市房地產開發企業的開發經營能力及資本運作能力,對上市房企經營實力及行業地位進行評判,最終形成頗具行業影響力的“2020中國上市房企百強”研究成果。
榜單解讀顯示,2020中國上市房企百強合計銷售額達到10.5萬億元,平均同比增速為17.5%,相比2019年下降24.4個百分點。行業集中度繼續上升,2019年TOP10房企銷售集中度為28%,碧桂園、萬科、恆大、融創等企業銷售規模穩步提升。
2019年百強房企加權平均淨利潤率為13.7%,較2018年下降0.3個百分點,但碧桂園、融創、龍光等企業仍實現較高的淨利潤率;從償債能力來看,TOP10房企平均淨負債率低至62.9%,現金短債比高至2.2倍,償債壓力最小。整體來看,百強房企的財務槓桿處於下降趨勢,碧桂園等房企始終處於較低的槓桿水平。
2019年碧桂園銷售規模繼續領跑行業,盈利持續增長,經營風格更趨穩健。年報數據顯示,碧桂園2019年共實現權益合同銷售金額約5522億元,同比增長10%,銷售繼續領跑全行業。同時,全年營業收入約為4859.1億元,同比增長28.2%,毛利潤、淨利潤分別約為1266.4億元和612億元,分別同比增長23.6%和26.1%。
在行業資金面持續收緊的背景下,碧桂園自2016年起第四次連續在年末實現正淨經營性現金流,達到146.7億元。年末可動用現金餘額約2683.5億元,達到公司有史以來最高水平。同時,淨借貸比率較2018年同比下降3.3百分點,僅為46.3%。
碧桂園持續增長的銷售業績和穩健的財務風格,以及較強的抵禦風險能力,獲國際權威信用評級機構的肯定和認可。惠譽給予投資級的BBB-企業信用評級,標普及穆迪也分別給予碧桂園BB+及Ba1評級,距投資級均只有一級之遙。2019年8月,穆迪又將對碧桂園的展望由“穩定”調升至“正面”,反映出市場對於碧桂園未來發展的信心。
前不久,碧桂園還入選《福布斯》“2020年上市公司2000強榜單”,位列第111名,較2019年排名上升18位,已連續第11年實現排名提升,展現出強勁的發展勢頭。
Follow us
Find us on
Facebook,
Twitter ,
Instagram, and
YouTube or frequent updates on all things investing.Have a financial topic you would like to discuss? Head over to the
uSMART Community to share your thoughts and insights about the market! Click the picture below to download and explore uSMART app!

Disclaimers
uSmart Securities Limited (“uSmart”) is based on its internal research and public third party information in preparation of this article. Although uSmart uses its best endeavours to ensure the content of this article is accurate, uSmart does not guarantee the accuracy, timeliness or completeness of the information of this article and is not responsible for any views/opinions/comments in this article. Opinions, forecasts and estimations reflect uSmart’s assessment as of the date of this article and are subject to change. uSmart has no obligation to notify you or anyone of any such changes. You must make independent analysis and judgment on any matters involved in this article. uSmart and any directors, officers, employees or agents of uSmart will not be liable for any loss or damage suffered by any person in reliance on any representation or omission in the content of this article. The content of the article is for reference only and does not constitute any offer, solicitation, recommendation, opinion or guarantee of any securities, virtual assets, financial products or instruments. Regulatory authorities may restrict the trading of virtual asset-related ETFs to only investors who meet specified requirements. Any calculations or images in the article are for illustrative purposes only.
Investment involves risks and the value and income from securities may rise or fall. Past performance is not indicative of future performance. Please carefully consider your personal risk tolerance, and consult independent professional advice if necessary.


