新股評級 | 稀美資源(9936.HK):國內鉭鈮冶金龍頭亮點不足,資源股定價估值不宜太高


若稀美資源以下限定價,尚值一搏。
作者 | 抹茶拿鐵
來源 | 格隆匯新股
數據支持 | 勾股大數據
本評級主要圍繞行業、公司、市場三大維度,針對目標公司各項核心指標進行打分評級,滿分為10分,各指標單獨評分,按“(權重佔比*分數)之和” 計算,最終結果按照四捨五入得到。
格隆匯新股研究根據已公開數據及獨家的內部評級體系,給予稀美資源的新股綜合評估分數為5(滿分為10分),如下圖:
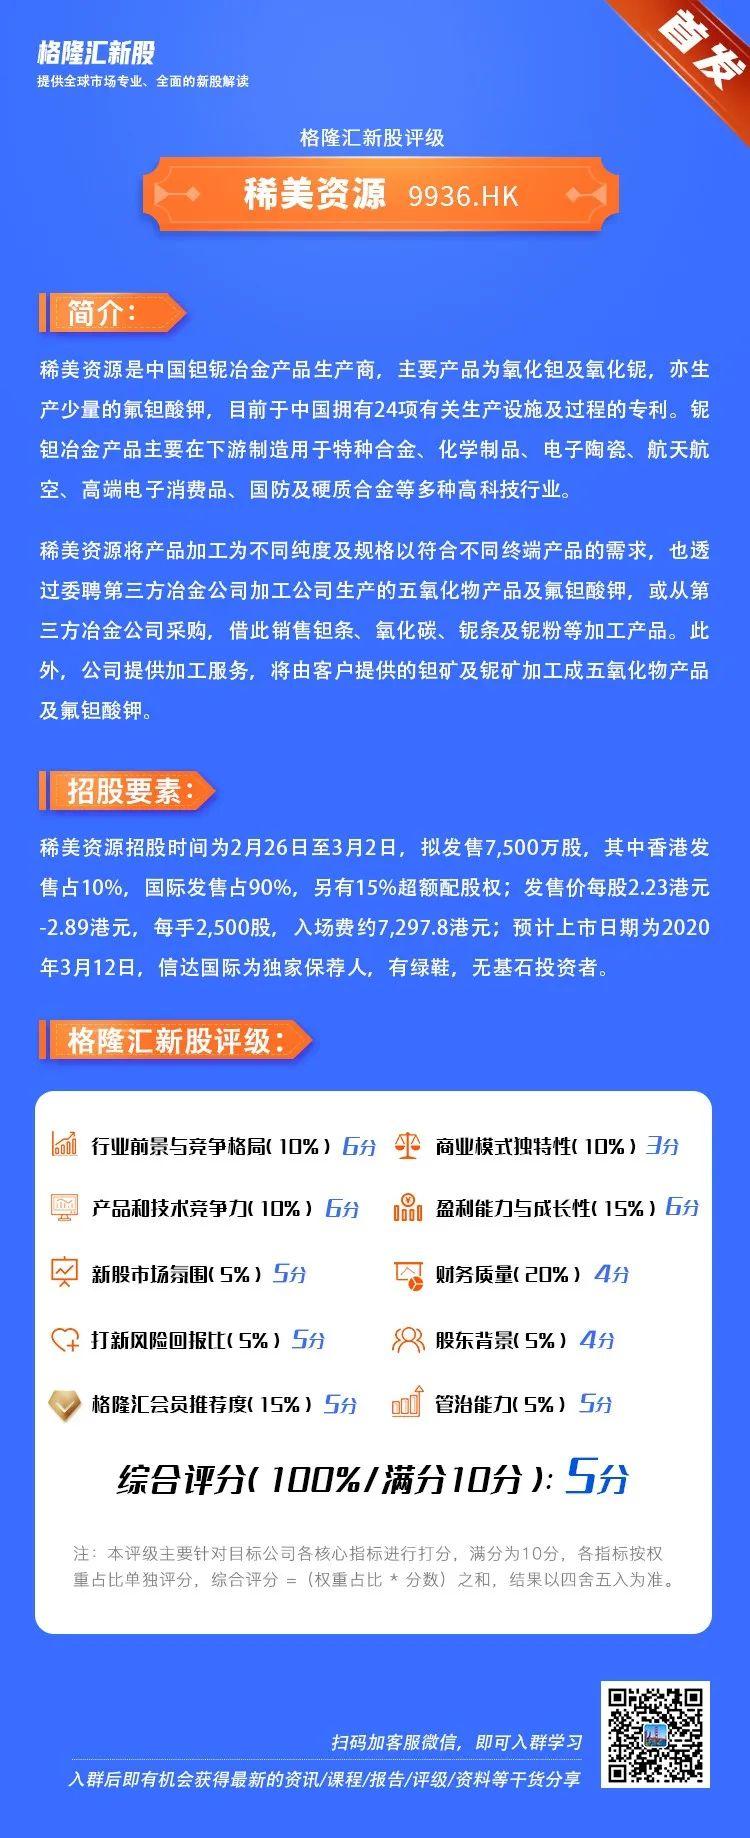
下面進入新股評分重點簡述:
1、2018年,按對外銷售年產量計,稀美資源為中國最大的鉭鈮濕法冶金產品生產商,佔市場份額約35.8%。從產業競爭格局來看,公司位於產業鏈中游,中國鉭鈮冶金產品的市場較為集中,2018年行業TOP5參與者市佔率達到82.9%,鑑於行業具備較高的准入門檻,龍頭公司競爭壓力不大。
2、隨着航天航空、高端電子品消費等行業的發展,中國氧化鉭及氧化鈮的市場規模增長勢頭較快,2018年產量分別達到了590噸及2250噸,年複合增長率分別為20.5%及13.6%,預計於2023年市場規模將分別達到851.9噸及3248.9噸,年複合增長率均為7.6%,整體行業成長空間穩健。
3、2016-2018年度,稀美資源的收入分別為2.17億元、3.07億元及5.15億元,年複合增速為54.1%,收入規模擴張迅速。公司大部分的收入來自中國客户,2016年以來佔比份額均保持在80%以,因此業務跟隨中國經濟波動。近期在疫情的影響下,全球供應鏈紊亂, 對公司下游的需求將造成一定程度的衝擊。
4、經營效率方面,2016-2018年度,稀美資源的毛利率分別為23.8%、28.4%及32.1%,保持穩健上升的態勢,不過於2019年前8個月下滑至27.5%。公司毛利率下滑主要是由於產品的售價有所下降,以及期內動用的存貨原材料購買價格較高所致,可見公司的經營效率被上下游的價格行情明顯牽制。
5、稀美資源過往的收入增速雖然快,但也犧牲了一定的財務質量。2016-2018年度,稀美資源的貿易應收賬款及應收票據總額分別為5514.9萬元、7123.5萬元及6868.4萬元。2019年前8個月,公司的貿易應收賬款及應收票據已經高達1.48億元,是過往應收規模的2倍有餘,回款能力似乎沒有跟上業務擴張速度。同時,公司還面臨着存貨滯銷的風險,存貨從2016年底的2590萬元增長至2019年8月31日止的9010萬元。在存貨和應收賬款的增加下,公司的現金流也承受了一定的壓力,2016-2018年度的經營活動現金流分別為1.5萬元、-1958萬元及5000.1萬元。
6、根據稀美資源在招股書中的融資用途,募資金額的68.8%(約1.015億港元)將用於擴充生產至下游產品,包括建設新生產設施、購置及安裝相關機器等,對公司未來的業績增長將產生直接的促進作用,但運作所需週期可能略長,同時需要考慮未來會產生更多的固定資產折舊費用。
7、以2018年度的淨利潤計算,稀美資源的市盈率約為7.8-10.1倍,預計2019年度的淨利潤水平將不低於6900萬元,對應的市盈率約為8.7-11.3倍。作為一家傳統的製造企業來説,上述估值較為合理,且稀土概念經過2018年的火熱後目前比較平穩,預料公司上市後的炒作空間一般。回顧保薦人信達國際的過往表現,經信達國際保薦的18只新股中有12只上市首日上漲,但近兩年金屬及礦業公司上市4家,首日破發3家,保發率僅25%,理應對資源股保持謹慎。綜合考量,若稀美資源以下限定價,尚值一搏。
8、以2.89港元的上限發行價計,稀美資源的市值僅為8.67億港元,市值偏小。同時,公司的股權較為集中,因此投資者需要提防該公司上市後股價波動幅度較大的潛在風險。

Follow us
Find us on
Facebook,
Twitter ,
Instagram, and
YouTube or frequent updates on all things investing.Have a financial topic you would like to discuss? Head over to the
uSMART Community to share your thoughts and insights about the market! Click the picture below to download and explore uSMART app!

Disclaimers
uSmart Securities Limited (“uSmart”) is based on its internal research and public third party information in preparation of this article. Although uSmart uses its best endeavours to ensure the content of this article is accurate, uSmart does not guarantee the accuracy, timeliness or completeness of the information of this article and is not responsible for any views/opinions/comments in this article. Opinions, forecasts and estimations reflect uSmart’s assessment as of the date of this article and are subject to change. uSmart has no obligation to notify you or anyone of any such changes. You must make independent analysis and judgment on any matters involved in this article. uSmart and any directors, officers, employees or agents of uSmart will not be liable for any loss or damage suffered by any person in reliance on any representation or omission in the content of this article. The content of the article is for reference only and does not constitute any offer, solicitation, recommendation, opinion or guarantee of any securities, virtual assets, financial products or instruments. Regulatory authorities may restrict the trading of virtual asset-related ETFs to only investors who meet specified requirements. Any calculations or images in the article are for illustrative purposes only.
Investment involves risks and the value and income from securities may rise or fall. Past performance is not indicative of future performance. Please carefully consider your personal risk tolerance, and consult independent professional advice if necessary.


