东风集团股份(00489.HK):中报净利逆势增长,但仍存一大隐忧?
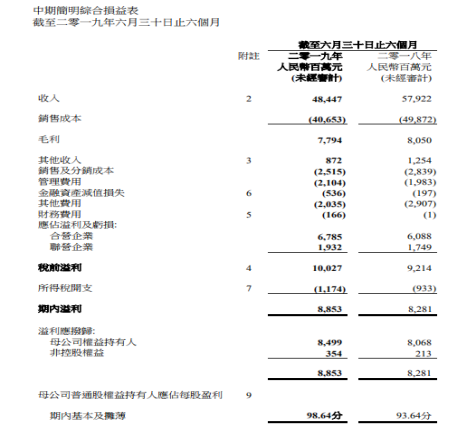
8月29日,港交所上市公司东风集团股份(00489.HK)发布2019年中期业绩。2019年1-6月,东风集团实现收入484.47亿元人民币(单位下同),同比减少16.36%;母公司权益持有人应占溢利84.99亿元,同比增加5.34%;每股盈利98.64分,拟派发中期股息每股0.1元。
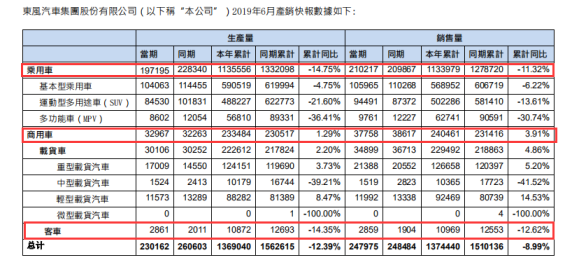
从销售数据来看,2019年上半年,东风集团共销售汽车约137.44万辆,同比下降约9.0%,降幅低于汽车行业整体降幅约3.4个百分点,市场占有约11.2%,相比去年同期提升0.5个百分点。
从车型的产销情况来看,2019年上半年,公司乘用车销售113.4万辆,同比下降约11.32%,降幅低于汽车行业乘用车整体降幅约2.7个百分点。
商用车方面,2019年上半年共销售约24.05万辆,同比增长3.91%,优于行业约8.0个百分点,其中中重卡销售约13.70万辆,同比下降约0.8%,降幅低于行业约5.0个百分点,轻卡销售约9.25万辆,同比增长约14.53%,领先行业16.2个百分点。
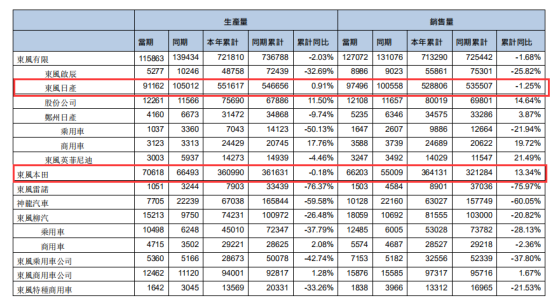
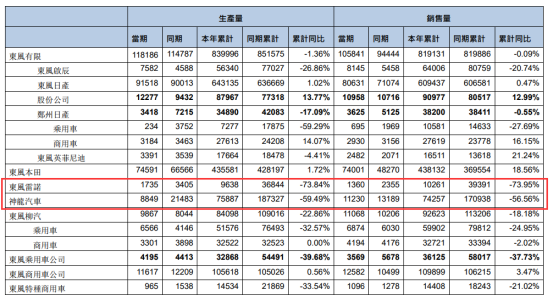
从品牌销售来看,公司合资品牌乘用车整体表现明显优于行业,而自主品牌乘用车表现弱于市场。具体品牌上,乘用车东风本田在2019年上半年表现一枝独秀,累计销售36.41万辆,同比增长13.34%,为公司上半年效益贡献很大;而东风日产品牌虽然同比下滑1.25%,但累计销售量依然超过50万辆,也是非常不错的成绩。
商用车方面,公司东风英菲尼迪在2019年上半年累计销售1.4万辆,同比增长21.49%,为公司商用车板块做出较大贡献。
而从公司最新7月产销数据来看,销售数据有所回暖。7月份,公司共销售汽车为220869辆,同比增长18.77%。品牌方面,日系车持续表现强劲。东风本田,7月同比大增53.3%至74001辆,1-7月累计销量438132辆,同比增长18.56%;东风日产7月份销售80631辆,同比增长13.45%,1-7月累计销量609437,同比增长0.47%。
但另一方面,法系车成为东风集团发展的一大隐忧,一直在拖累公司的整体业绩。从数据来看,截止2019年7月,东风雷诺2019年累计销售10261辆,同比减少73.95%;神龙汽车2019年累计销售74257辆,同比减少56.56%。
事实上,东风雷诺在2018年就出现较大的降幅,销量从2017年的7.2万辆下跌到2018年的不足5万辆,今年只不过是跌幅的进一步扩大。为扭转下滑局势,东风雷诺在今年7月就进行了一系列的人事调整,但从目前的销量来看,情况目前并未取得好转。
神龙汽车方面,旗下主要拥有两大品牌,一是东风标致,另一个是东风雪铁龙,相比东风雷诺,情况并没有好多少。
根据东风集团2018年的财报显示,合营企业神龙汽车及东风标致雪铁龙汽车销售实现收入36.52亿欧元(约278亿元),同比减少32.42%;期内亏损4.68亿欧元(约35.6亿元),亏损同比扩大680%。
为减少亏损,神龙汽车2019年上半年也进行了一系列组织机构和人事的调整,但仍未见成效。根据公司财报显示,神龙汽车在今年上半年的亏损扩大到25亿元,已占到去年亏损总额的70%。而根据媒体公开报道,神龙汽车正通过关闭工厂、人员分流等方式降低巨额亏损。
从汽车行业发展来看,2018年开始进入存量发展期,车市出现多年未遇的负增长。根据数据,2019年上半年,中国汽车行业共销售1232.29万辆,同比下降12.4%,其中,乘用车销量1012.65万辆,同比下降14.0%;商用车销售219.64万辆,同比下降4.1%。
未来,汽车行业低增速将呈常态化,市场竞争也将越发激烈。2019年,汽车整体市场将不会出现大幅增长,但随着汽车配置的提高,电动化、智能化、互联化等新技术的应用,汽车行业仍然具有发展的新空间。
综合来看,在整个汽车行业进入存量发展的大环境的下,东风汽车依然能够保持纯利增长态势,实属不易,这主要得益于东风本田及东风日产两大品牌的支撑。但同时,公司法系品牌车成为拖累公司业绩的一大隐忧,在没有处理好这一板块业务之前,公司业绩也很难有突出表现。
Follow us
Find us on
Facebook,
Twitter ,
Instagram, and
YouTube or frequent updates on all things investing.Have a financial topic you would like to discuss? Head over to the
uSMART Community to share your thoughts and insights about the market! Click the picture below to download and explore uSMART app!

Disclaimers
uSmart Securities Limited (“uSmart”) is based on its internal research and public third party information in preparation of this article. Although uSmart uses its best endeavours to ensure the content of this article is accurate, uSmart does not guarantee the accuracy, timeliness or completeness of the information of this article and is not responsible for any views/opinions/comments in this article. Opinions, forecasts and estimations reflect uSmart’s assessment as of the date of this article and are subject to change. uSmart has no obligation to notify you or anyone of any such changes. You must make independent analysis and judgment on any matters involved in this article. uSmart and any directors, officers, employees or agents of uSmart will not be liable for any loss or damage suffered by any person in reliance on any representation or omission in the content of this article. The content of the article is for reference only and does not constitute any offer, solicitation, recommendation, opinion or guarantee of any securities, virtual assets, financial products or instruments. Regulatory authorities may restrict the trading of virtual asset-related ETFs to only investors who meet specified requirements. Any calculations or images in the article are for illustrative purposes only.
Investment involves risks and the value and income from securities may rise or fall. Past performance is not indicative of future performance. Please carefully consider your personal risk tolerance, and consult independent professional advice if necessary.


