慕尚集团(01817.HK):上半年营收同比增10.6%,国民男装的未来依然可期?
8月28日早间,“新零售男装第一股”慕尚集团向外界展示了其2019年上半年业绩报告。
营收双位数增长
据公开资料显示,成立于2007年的慕尚集团,是国内具有代表性的新零售数字平台化发展式的时装公司。该公司除了经营时尚男装品牌GXG之外,还拥有gxgjeans、gxg.kids、Yatlas、2XU等品牌,与此同时还涉足鞋子、内衣等多种品类。2019年5月,该集团成功在港交所上市,被外界称为“国民男装新零售第一股”。
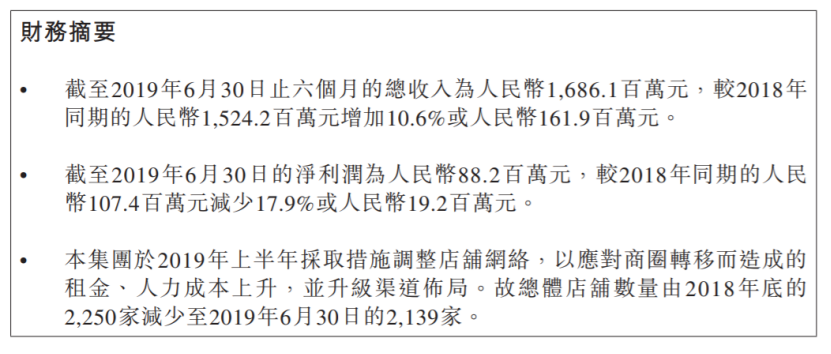
据财报显示,今年上半年,该公司总收入为人民币16.86亿元(单位下同),同比增加10.6%;净利润约8820万元,同比减少17.9%;母公司拥有人应占净利8967万元,同比减少约18.84%;每股盈利0.11分,不派息。
(资料来源:慕尚集团财报)
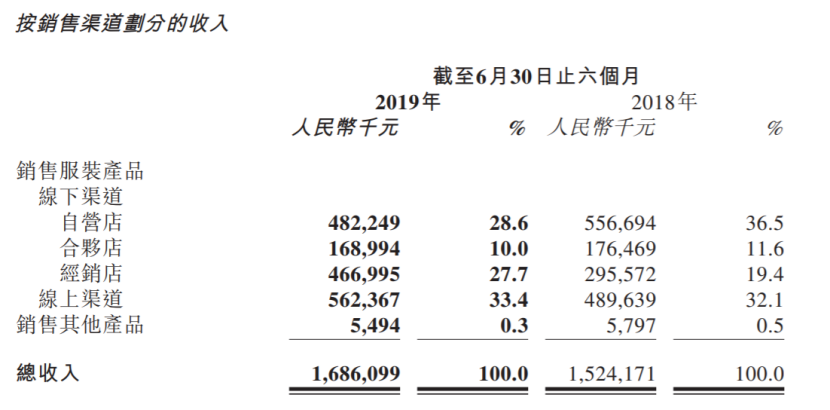
此外,值得一提的是,由于慕尚集团的收入主要来自透过其自营店、经销店、合伙店及在线渠道向终端客户销售产品。因此,我们从这几个细分门类说起。
今年上半年,该集团自营店销售减少13.4%至4.82亿元,合伙店销售减少4.2%至1.69亿元;经销店销售增加58.0%至4.67亿元;线上渠道销售保持高速增长,增加14.9%至5.62亿元。此外,在收入占比方面,在线渠道销售占比33.4%位列第一,其次分别为自营店28.6%与经销店27.7%。
(资料来源:慕尚集团财报)
此外,再来看看慕尚集团的毛利率表现。据财报显示,期间内,慕尚集团录得毛利总额为8.38亿元,同比减少1.4%,毛利率则于相同期间内由55.7%减少至49.7%。
而对于此,该公司表示,为了减少库存回笼资金,本集团加快对所有品牌中利润率较低的过季货品的促销力度,导致综合影响各品牌毛利率轻微下降,由此影响了公司的盈利状况。
国民男装的未来依然可期?
虽然,今年上半年,慕尚集团的净利润有所下滑,但不得不说的是,其所选定的赛道还是大有可为的。
据灼识咨询研报显示,中国服装市场产生的零售收入由2014年的人民币1.41万亿元增加至2018年的人民币2.31万亿元,复合年增长率为13.1%,并且预计未来依然维持强劲的增长势头,其表示:
“预计中国服装市场的零售收入于2023年将达到人民币4.02万亿元,2018年至2023年间按11.7%的复合年增长率增加。”
而在这个大环境中,中国时尚男装的市场逐渐开始“显山露水”。据相关数据显示,目前时尚男装已成为中国男装市场增长最迅速的部分之一,该时尚部分由2014年的人民币940亿元增长至2018年的人民币1700亿元,复合年增长率为16.5%。
在这其中,作为“新零售男装第一股”的慕尚集团自然获益不少。
一方面,即便慕尚保持行业的平均增长速度,其也能实现双位数的增长。另一方面,该公司未来有望在男装市场集中度持续提升的大势中受益。据灼识咨询研报显示,以零售总收入计,慕尚于2018年在中国时尚男装市场的占有率约为3.3%,全国排名第二。以线上零售总收入计,慕尚于2018年在中国排名第一,占线上零售总收入约5.2%,线上渗透率达到全国最高的36%。
而值得注意的是,今年下半年该行业可谓是机遇与挑战并存。具体而言,随着中国经济及消费增速放缓,加上国内各商业体和创新商业模式不断增加,预计今年下半年度服装行业会充满挑战。与此同时,由于一众对生活品味和创新模式有所追求的消费者群体对于功能性服装及时尚产品的需求与日俱增,也为时装业创造更多机会。
不过,受惠于其多品牌策略和品牌组合的优势,慕尚集团在财报中表示,依然对其发展前景充满信心,并且将采取以下措施:
1、通过多品牌策略发展新的产品组合和品牌矩阵,进一步整合在线线下新零售渠道,提升营运能力; 2、持续通过创新的营销手段,吸引更多追随者,并通过新零售技术和优势,提升会员的体验; 3、进一步发展领先的供应链系统,提升行业前后端的服务能力,通过提高产品质量和服务满足客户需求。
此外,值得一提的是,该公司作为一只次新股,股价自5月27日上市以来累计涨幅逾20%,由此可知,在行业形势未来依然维持强劲的增长势头下,投资者对其发展还是有一定信心的。
Follow us
Find us on
Facebook,
Twitter ,
Instagram, and
YouTube or frequent updates on all things investing.Have a financial topic you would like to discuss? Head over to the
uSMART Community to share your thoughts and insights about the market! Click the picture below to download and explore uSMART app!

Disclaimers
uSmart Securities Limited (“uSmart”) is based on its internal research and public third party information in preparation of this article. Although uSmart uses its best endeavours to ensure the content of this article is accurate, uSmart does not guarantee the accuracy, timeliness or completeness of the information of this article and is not responsible for any views/opinions/comments in this article. Opinions, forecasts and estimations reflect uSmart’s assessment as of the date of this article and are subject to change. uSmart has no obligation to notify you or anyone of any such changes. You must make independent analysis and judgment on any matters involved in this article. uSmart and any directors, officers, employees or agents of uSmart will not be liable for any loss or damage suffered by any person in reliance on any representation or omission in the content of this article. The content of the article is for reference only and does not constitute any offer, solicitation, recommendation, opinion or guarantee of any securities, virtual assets, financial products or instruments. Regulatory authorities may restrict the trading of virtual asset-related ETFs to only investors who meet specified requirements. Any calculations or images in the article are for illustrative purposes only.
Investment involves risks and the value and income from securities may rise or fall. Past performance is not indicative of future performance. Please carefully consider your personal risk tolerance, and consult independent professional advice if necessary.


