博弈科创板不如抄底质优科技股?
作者: 林荣华
来源:中国证券报
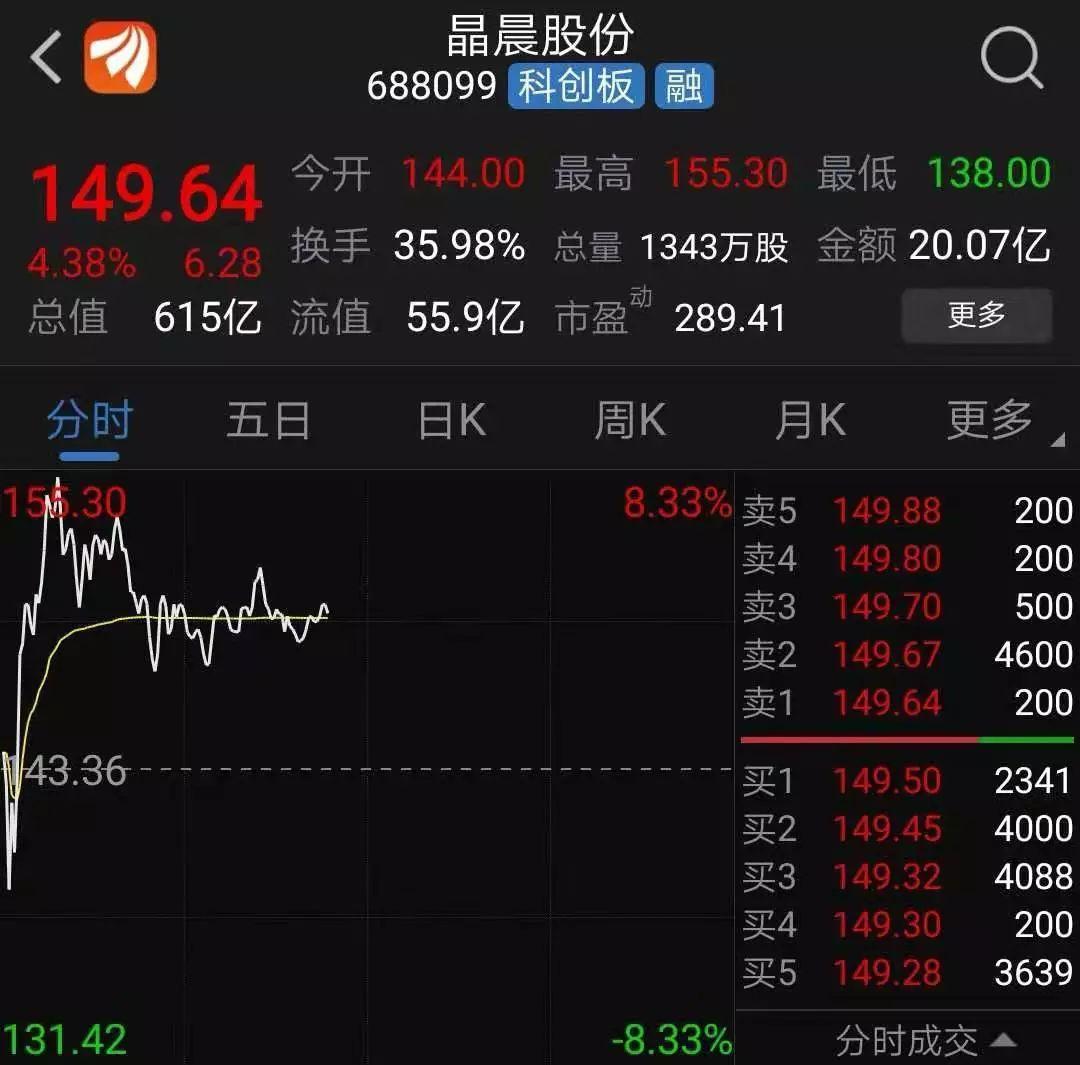
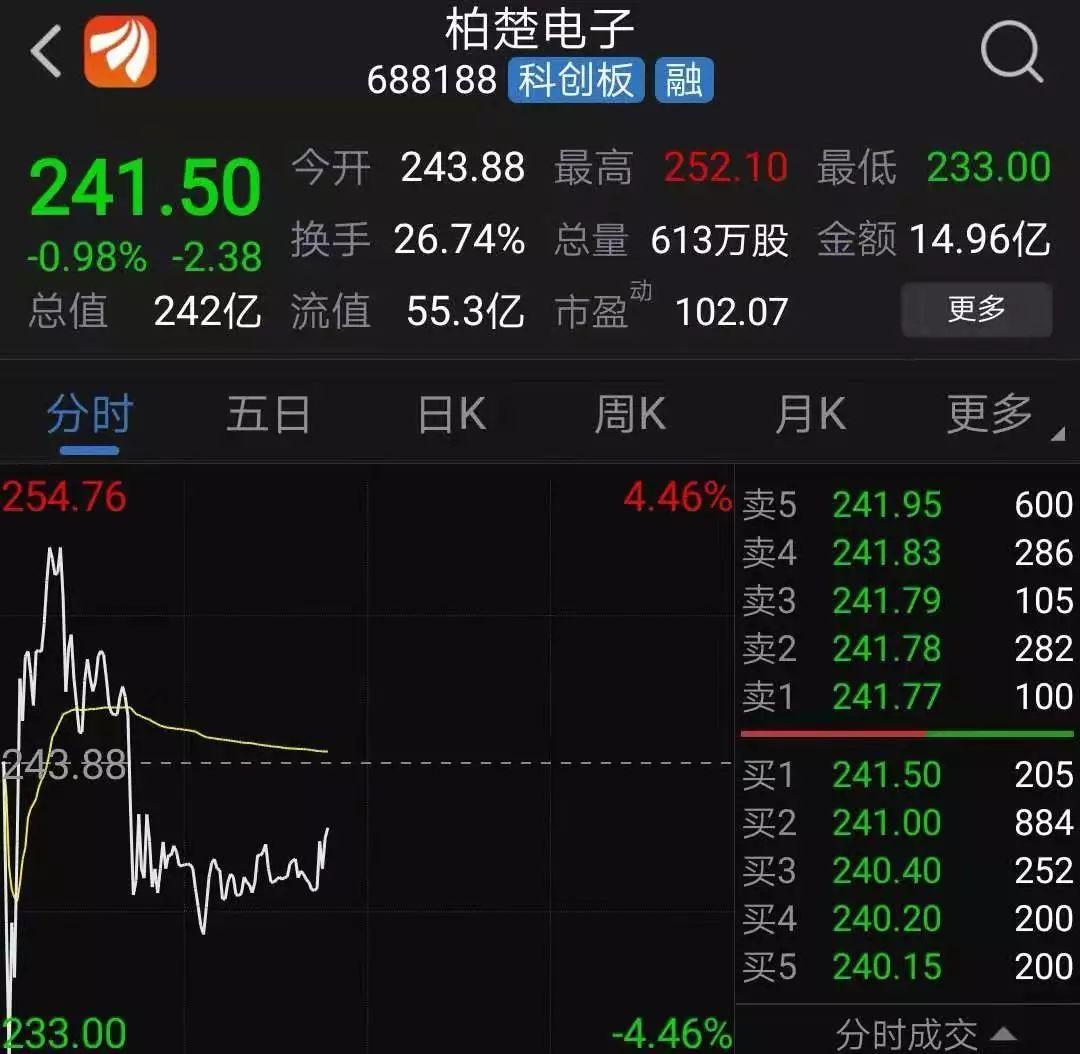
今日是第二批科创板新股晶晨股份、柏楚电子上市第二个交易日,两只新股早盘表现稳定。截至午盘,晶晨股份涨4.38%,柏楚电子跌0.98%。
不过一个现象值得投资者注意,据上交所披露数据显示,晶晨股份、柏楚电子昨日融券余额分别比其融资余额高出7547.53万元和4333.06万元。
由于科创板股票上市首日即可融资融券,战略投资者可以将解禁期内的股票借出以供投资者融券,科创板股票的做空机制得到疏通,利于市场价值发现。
业内人士表示,当前,科创板成交活跃、波动较大,科创板融券将保持活跃,进行日内回转交易和试水市场中性策略的机构对券源还有较大需求。随着科创板上市企业不断增多,溢价会逐步消失,估值将会回归。
新气象:两新股融券余额大幅超融资余额
昨日上市的科创板股票晶晨股份、柏楚电子表现大幅超出首批25只科创板新股首日表现:开盘价均超200%,此前25只科创板新股首日开盘价平均涨幅仅为140.95%;收盘价涨幅均超250%,位列27只已上市科创板新股中首日涨幅榜前五。同时,晶晨股份、柏楚电子上市首日的振幅分别只有80.52%和90.92%,而首批25只科创板股票上市首日的平均振幅达156.90%。
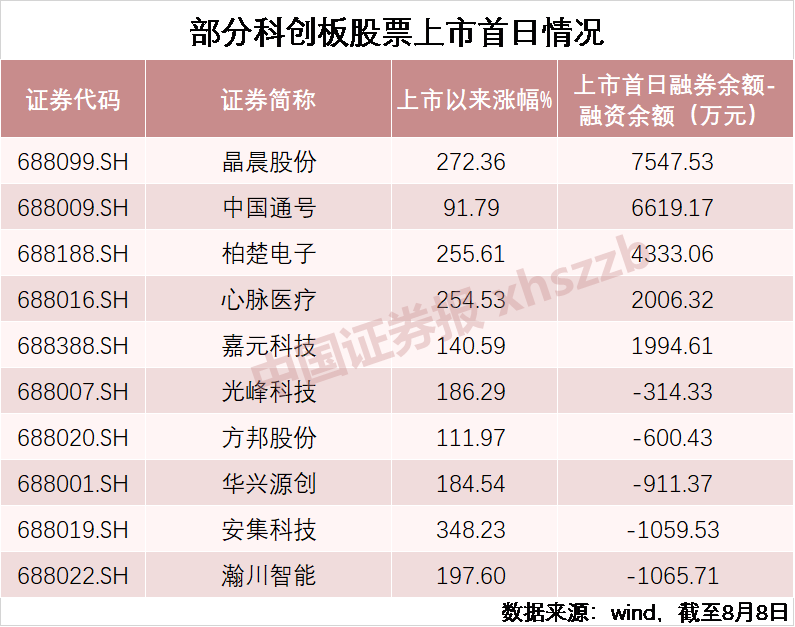
首日大涨之下,两只新股的融券余额也大幅攀升,甚至超过了其融资余额。Wind数据显示,8月8日,晶晨股份、柏楚电子的融券余额分别为1.69亿元和1.51亿元,分别比其融资余额高出7547.53万元和4333.06万元。这在首批25只科创板股票中仅有3只:中国通号上市首日融券余额比融资余额高6619.17万元,心脉医疗、嘉元科技融融券余额比融资余额分别高出2006.32万元和1994.61万元。
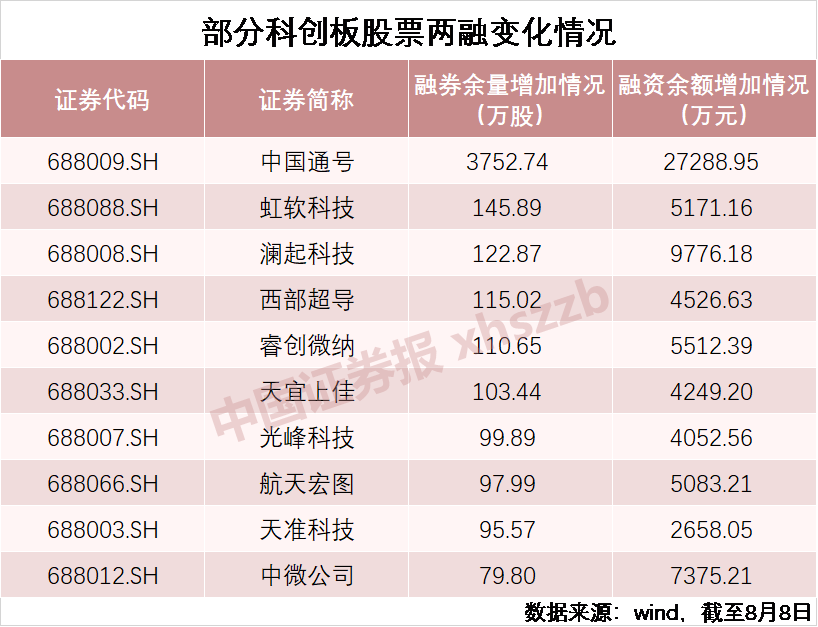
整体上看,科创板融资与融券业务活跃度都比较高。截至8月8日,27只科创板股票融资余额合计30.47亿元,融券余额28.38亿元。而在7月22日,25只科创板股票融资余额合计12.75亿元,融券余额合计7.97亿元。上市以来科创板融券余额增长势头更快。
融资博弈科创板个股风险高
不如抄底映射质优科技股
据业内人士介绍,科创板融券券源供应紧张,融券利率一般都在18%左右,融券利率最低的中国通号,也在10%以上,而一般融资买入的利率在8%左右。这表明,科创板融券方承担的利率成本高于融资方。
记者了解到,科创板融券券源主要供机构客户使用,一般依托有稳定盈利的交易模型,用于日内回转交易赚取差价,即先高位融券卖出,再低位买入还券;或者先低位买入,再高位融券卖出。
从科创板上市前两周的情况看,较高的活跃度和较大的振幅为此类交易提供了很好的获利空间。Wind数据显示,除去上市首日,上市首周25只科创板个股的日均振幅平均为12.56%,上市第二周的日均振幅为11.16%。换手率方面,除去上市首日,上市首周的日均换手率平均为38.18%,上市第二周的日均换手率分别为41.33%。
除了借助融券通过日内回转交易赚取差价,试水市场中性策略是更多机构投资者的目标。据私募人士介绍,市场中性策略的一般做法是根据模型持有个股组合,然后融券大盘股,起到对冲作用,直接融券个股的效果会比股指期货更好。
关于科创板融资,有公募人士向记者表示,科创板目前还是属于情绪比较高亢的阶段,估值上一直是属于偏高的,机构基本不会参与做多。对于普通投资者而言,也不宜参与这种高风险的纯博弈行情,加杠杆融资买入更不可取。该人士表示,短期内科创板股票只有回落到发行价的110%-120%的价位,才可能有买入的意愿。事实上,当前投资者与其参与博弈行情,不如趁着主板、中小板、创业板回调,抄底更具估值吸引力的优质科技股。
Follow us
Find us on
Facebook,
Twitter ,
Instagram, and
YouTube or frequent updates on all things investing.Have a financial topic you would like to discuss? Head over to the
uSMART Community to share your thoughts and insights about the market! Click the picture below to download and explore uSMART app!

Disclaimers
uSmart Securities Limited (“uSmart”) is based on its internal research and public third party information in preparation of this article. Although uSmart uses its best endeavours to ensure the content of this article is accurate, uSmart does not guarantee the accuracy, timeliness or completeness of the information of this article and is not responsible for any views/opinions/comments in this article. Opinions, forecasts and estimations reflect uSmart’s assessment as of the date of this article and are subject to change. uSmart has no obligation to notify you or anyone of any such changes. You must make independent analysis and judgment on any matters involved in this article. uSmart and any directors, officers, employees or agents of uSmart will not be liable for any loss or damage suffered by any person in reliance on any representation or omission in the content of this article. The content of the article is for reference only and does not constitute any offer, solicitation, recommendation, opinion or guarantee of any securities, virtual assets, financial products or instruments. Regulatory authorities may restrict the trading of virtual asset-related ETFs to only investors who meet specified requirements. Any calculations or images in the article are for illustrative purposes only.
Investment involves risks and the value and income from securities may rise or fall. Past performance is not indicative of future performance. Please carefully consider your personal risk tolerance, and consult independent professional advice if necessary.


